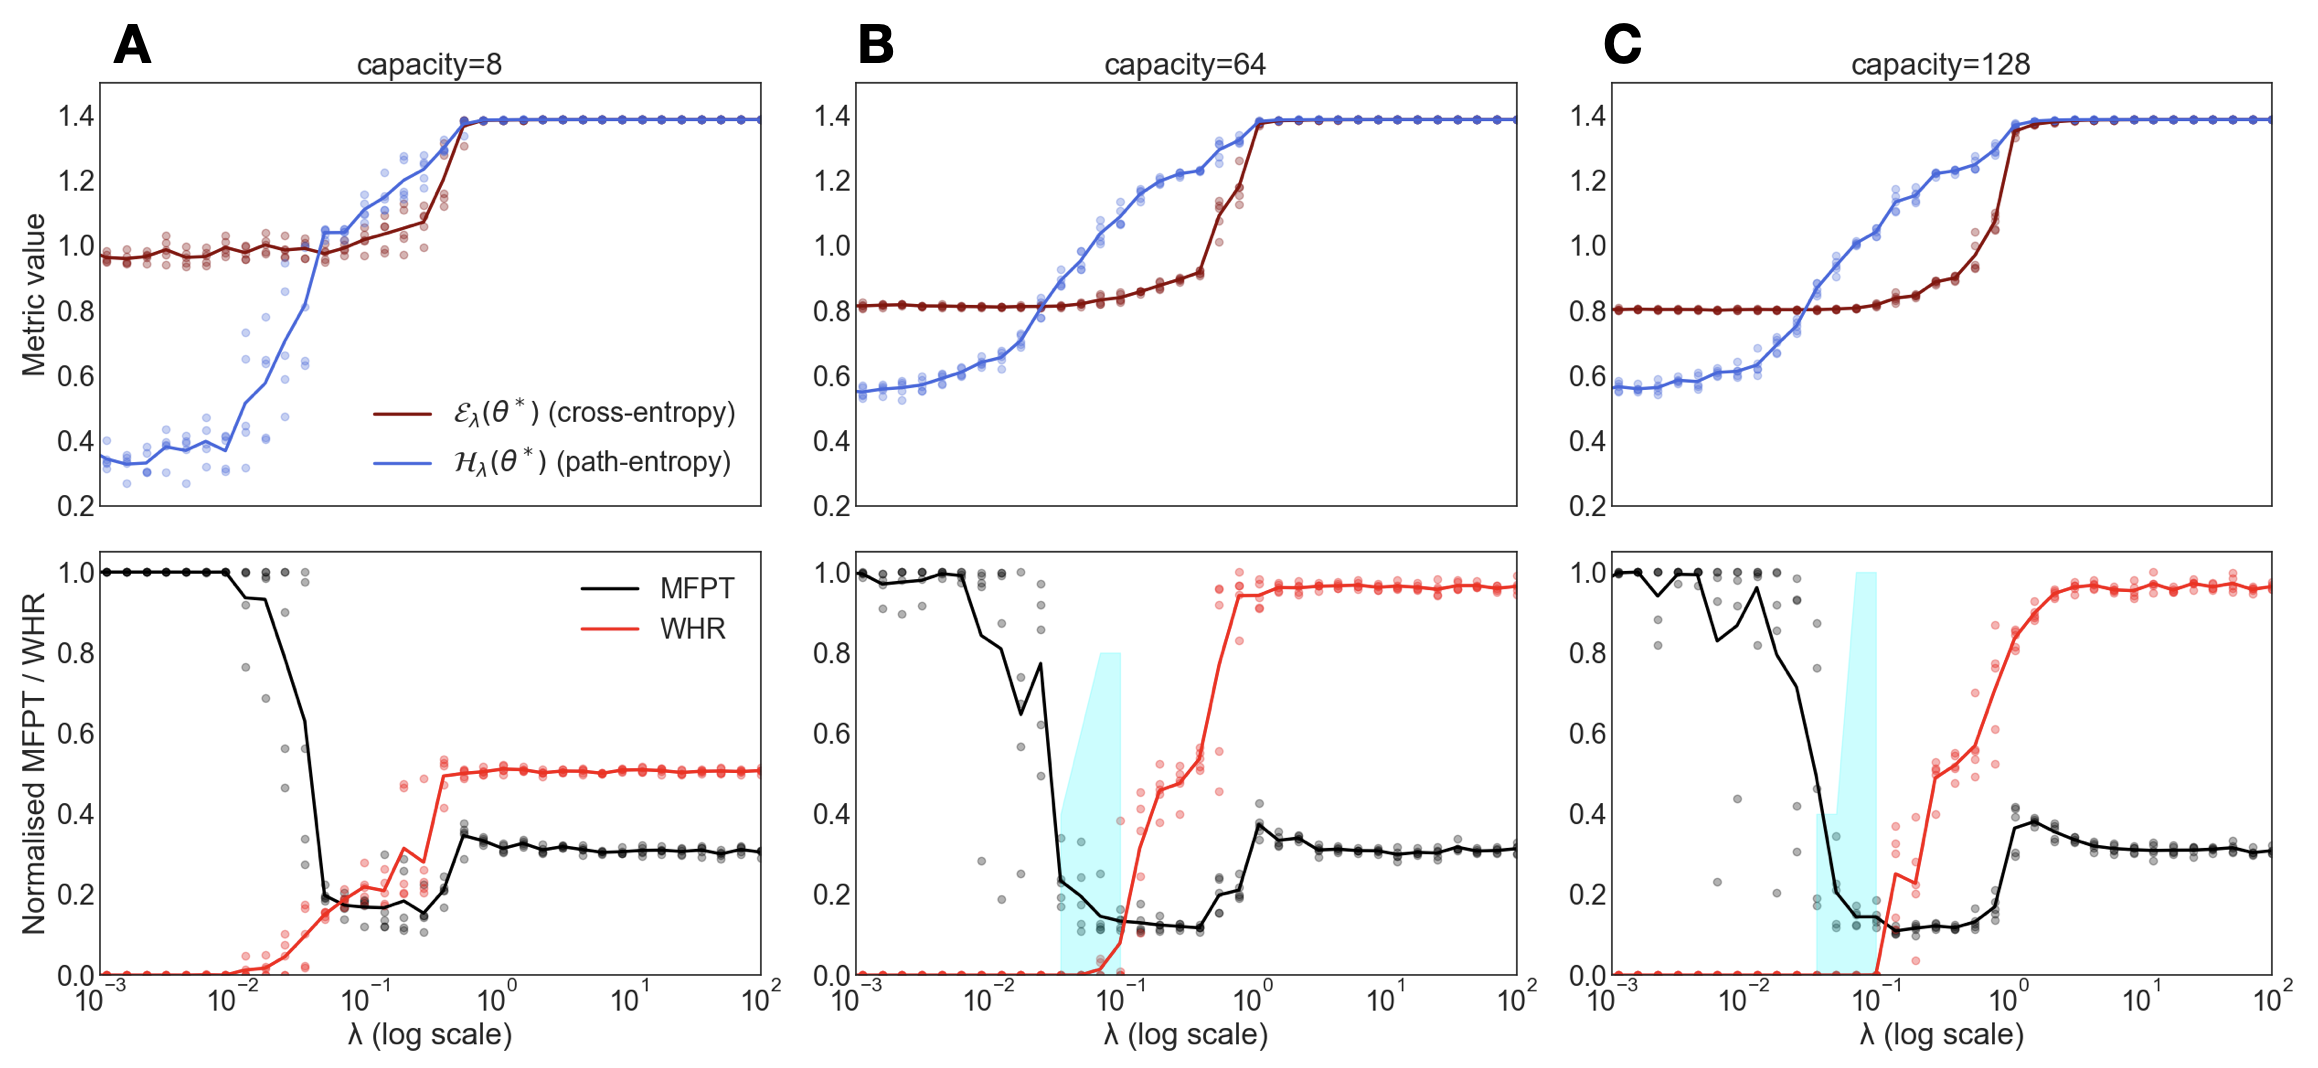
## Line Charts: Metric Value and Normalized MFPT/WHR vs. Lambda (Log Scale)
### Overview
The image presents three sets of line charts (A, B, and C), each containing two subplots. The top subplot in each set displays the "Metric value" against "λ (log scale)" for two different metrics: cross-entropy and path-entropy. The bottom subplot in each set shows "Normalized MFPT / WHR" against "λ (log scale)" for MFPT and WHR. The three sets of charts (A, B, and C) correspond to different capacity values: 8, 64, and 128, respectively.
### Components/Axes
**General Chart Elements:**
* **Titles:** Each set of charts is labeled A, B, or C in the top-left corner. Above each set of charts is a "capacity" value (8, 64, or 128).
* **X-axis:** The x-axis is labeled "λ (log scale)" and ranges from 10^-3 to 10^2.
* **Y-axis (Top Subplot):** The y-axis is labeled "Metric value" and ranges from 0.2 to 1.4.
* **Y-axis (Bottom Subplot):** The y-axis is labeled "Normalized MFPT / WHR" and ranges from 0.0 to 1.0.
* **Legend (Top Subplot):** Located in the middle-right of the top subplot.
* Red line: ελ(θ*) (cross-entropy)
* Blue line: Hλ(θ*) (path-entropy)
* **Legend (Bottom Subplot):** Located in the right of the bottom subplot.
* Black line: MFPT
* Red line: WHR
* **Highlight:** A light blue vertical bar highlights a region on the x-axis, located around λ = 10^-1.
**Specific Chart Details:**
* **Chart A (capacity=8):**
* Top Subplot: Metric value vs. λ (log scale)
* Bottom Subplot: Normalized MFPT / WHR vs. λ (log scale)
* **Chart B (capacity=64):**
* Top Subplot: Metric value vs. λ (log scale)
* Bottom Subplot: Normalized MFPT / WHR vs. λ (log scale)
* **Chart C (capacity=128):**
* Top Subplot: Metric value vs. λ (log scale)
* Bottom Subplot: Normalized MFPT / WHR vs. λ (log scale)
### Detailed Analysis
**Chart A (capacity=8):**
* **Top Subplot:**
* Cross-entropy (red): Relatively constant at approximately 1.0 from λ = 10^-3 to 10^-1, then increases to approximately 1.2 at λ = 10^0, and remains relatively constant at approximately 1.2 from λ = 10^0 to 10^2.
* Path-entropy (blue): Starts at approximately 0.35 at λ = 10^-3, increases gradually to approximately 0.6 at λ = 10^-1, then increases sharply to approximately 1.4 at λ = 10^0, and remains relatively constant at approximately 1.4 from λ = 10^0 to 10^2.
* **Bottom Subplot:**
* MFPT (black): Constant at 1.0 from λ = 10^-3 to 10^-2, then decreases sharply to approximately 0.2 at λ = 10^-1, and remains relatively constant at approximately 0.3 from λ = 10^-1 to 10^2.
* WHR (red): Starts at approximately 0.0 at λ = 10^-3, increases to approximately 0.2 at λ = 10^-1, then increases to approximately 0.5 at λ = 10^0, and remains relatively constant at approximately 0.5 from λ = 10^0 to 10^2.
**Chart B (capacity=64):**
* **Top Subplot:**
* Cross-entropy (red): Relatively constant at approximately 0.8 from λ = 10^-3 to 10^-1, then increases to approximately 1.3 at λ = 10^0, and remains relatively constant at approximately 1.3 from λ = 10^0 to 10^2.
* Path-entropy (blue): Starts at approximately 0.6 at λ = 10^-3, increases gradually to approximately 1.3 at λ = 10^0, and remains relatively constant at approximately 1.4 from λ = 10^0 to 10^2.
* **Bottom Subplot:**
* MFPT (black): Constant at 1.0 from λ = 10^-3 to 10^-2, then decreases sharply to approximately 0.1 at λ = 10^-1, and remains relatively constant at approximately 0.3 from λ = 10^-1 to 10^2.
* WHR (red): Starts at approximately 0.0 at λ = 10^-3, increases sharply to approximately 1.0 at λ = 10^0, and remains relatively constant at approximately 1.0 from λ = 10^0 to 10^2.
**Chart C (capacity=128):**
* **Top Subplot:**
* Cross-entropy (red): Relatively constant at approximately 0.8 from λ = 10^-3 to 10^-1, then increases to approximately 1.3 at λ = 10^0, and remains relatively constant at approximately 1.3 from λ = 10^0 to 10^2.
* Path-entropy (blue): Starts at approximately 0.6 at λ = 10^-3, increases gradually to approximately 1.3 at λ = 10^0, and remains relatively constant at approximately 1.4 from λ = 10^0 to 10^2.
* **Bottom Subplot:**
* MFPT (black): Constant at 1.0 from λ = 10^-3 to 10^-2, then decreases sharply to approximately 0.1 at λ = 10^-1, and remains relatively constant at approximately 0.3 from λ = 10^-1 to 10^2.
* WHR (red): Starts at approximately 0.0 at λ = 10^-3, increases sharply to approximately 1.0 at λ = 10^0, and remains relatively constant at approximately 1.0 from λ = 10^0 to 10^2.
### Key Observations
* As capacity increases (from 8 to 64 to 128), the transition point where path-entropy increases and MFPT decreases shifts to the left (lower λ values).
* The cross-entropy remains relatively constant for low λ values and then increases to a plateau for higher λ values.
* The MFPT decreases sharply around λ = 10^-1, while the WHR increases sharply around λ = 10^-1.
* The light blue vertical bar highlights a region around λ = 10^-1, which seems to be a critical transition point for MFPT and WHR.
### Interpretation
The charts illustrate the relationship between different metrics (cross-entropy, path-entropy, MFPT, and WHR) and the regularization parameter λ for different model capacities. The data suggests that as the model capacity increases, the model becomes more sensitive to the regularization parameter λ. The transition point where the model behavior changes (as indicated by the sharp changes in MFPT and WHR) shifts to lower λ values with increasing capacity. This implies that higher capacity models require stronger regularization (lower λ) to prevent overfitting. The highlighted region around λ = 10^-1 seems to be a critical point where the model transitions from one behavior to another. The cross-entropy and path-entropy metrics also show changes around this region, indicating a shift in the model's learning dynamics.