## Bar Chart: Accuracy by Condition
### Overview
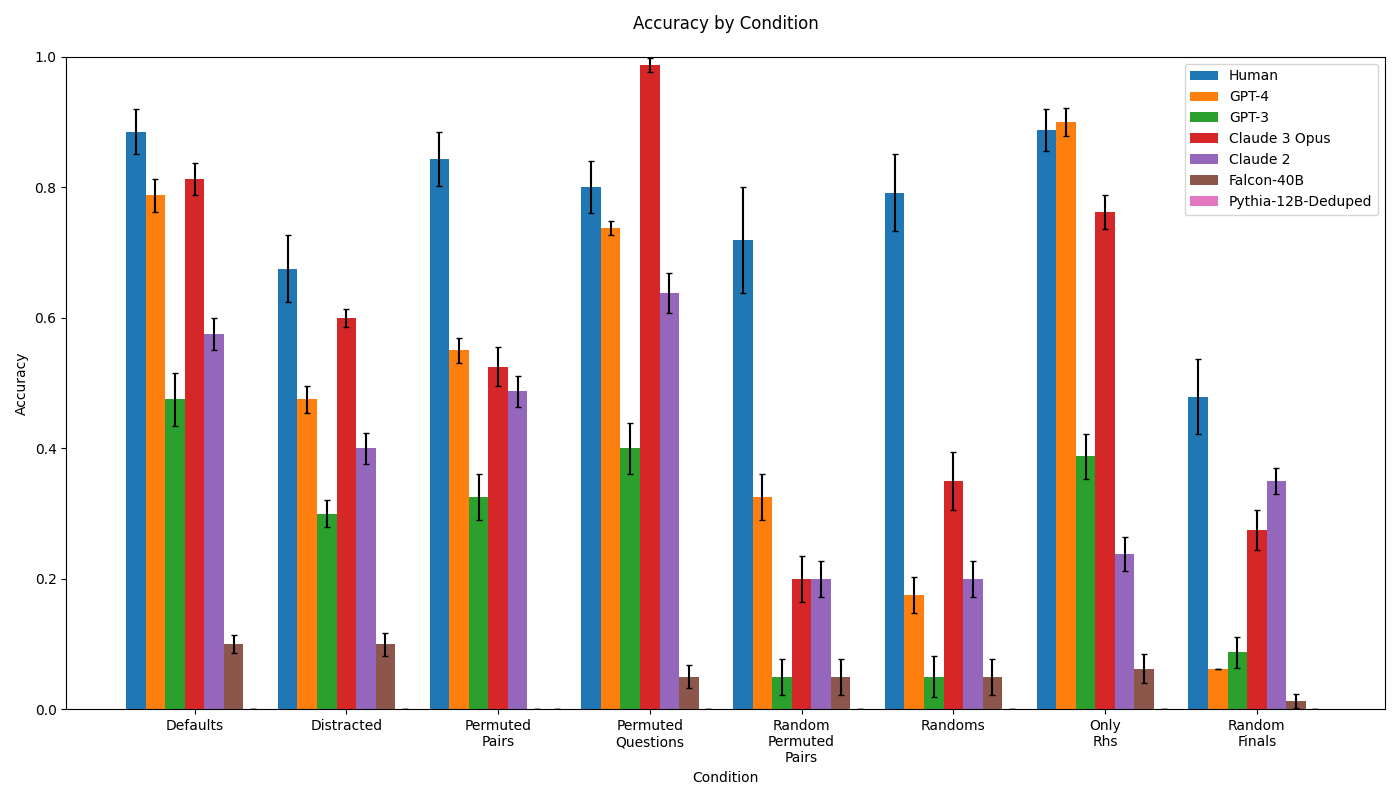
This is a grouped bar chart titled "Accuracy by Condition." It compares the performance accuracy of seven different entities (one human and six AI models) across eight distinct experimental conditions. The chart includes error bars for each data point, indicating variability or confidence intervals. The primary language is English.
### Components/Axes
- **Title**: "Accuracy by Condition" (top center).
- **Y-axis**: Labeled "Accuracy." Scale ranges from 0.0 to 1.0, with major tick marks at 0.0, 0.2, 0.4, 0.6, 0.8, and 1.0.
- **X-axis**: Labeled "Condition." Contains eight categorical conditions:
1. Defaults
2. Distracted
3. Permuted Pairs
4. Permuted Questions
5. Random Permuted Pairs
6. Randoms
7. Only Rhs
8. Random Finals
- **Legend**: Located in the top-right corner. Maps colors to entities:
- Blue: Human
- Orange: GPT-4
- Green: GPT-3
- Red: Claude 3 Opus
- Purple: Claude 2
- Brown: Falcon-40B
- Pink: Pythia-12B-Deduped
- **Data Series**: Each condition on the x-axis has a cluster of up to seven bars, one for each entity in the legend. Error bars (black vertical lines) cap each bar.
### Detailed Analysis
The following table reconstructs the approximate accuracy values for each entity across all conditions. Values are estimated from the bar heights relative to the y-axis. The presence of an error bar is noted, but its exact range is approximate. The entity "Pythia-12B-Deduped" (pink) does not have a visible bar in any condition, suggesting its accuracy is at or near 0.0 for all tests shown.
| Condition | Human (Blue) | GPT-4 (Orange) | GPT-3 (Green) | Claude 3 Opus (Red) | Claude 2 (Purple) | Falcon-40B (Brown) | Pythia-12B-Deduped (Pink) |
| :--- | :--- | :--- | :--- | :--- | :--- | :--- | :--- |
| **Defaults** | ~0.88 (±0.04) | ~0.79 (±0.03) | ~0.48 (±0.04) | ~0.81 (±0.03) | ~0.58 (±0.03) | ~0.10 (±0.02) | Not visible (~0.0) |
| **Distracted** | ~0.68 (±0.05) | ~0.48 (±0.02) | ~0.30 (±0.02) | ~0.60 (±0.02) | ~0.40 (±0.03) | ~0.10 (±0.02) | Not visible (~0.0) |
| **Permuted Pairs** | ~0.84 (±0.05) | ~0.55 (±0.02) | ~0.33 (±0.04) | ~0.52 (±0.04) | ~0.49 (±0.03) | ~0.05 (±0.01) | Not visible (~0.0) |
| **Permuted Questions** | ~0.80 (±0.04) | ~0.74 (±0.02) | ~0.40 (±0.04) | **~0.99 (±0.01)** | ~0.64 (±0.03) | ~0.05 (±0.02) | Not visible (~0.0) |
| **Random Permuted Pairs** | ~0.72 (±0.08) | ~0.33 (±0.04) | ~0.05 (±0.03) | ~0.20 (±0.03) | ~0.20 (±0.03) | ~0.05 (±0.03) | Not visible (~0.0) |
| **Randoms** | ~0.79 (±0.06) | ~0.18 (±0.03) | ~0.05 (±0.03) | ~0.35 (±0.05) | ~0.20 (±0.03) | ~0.05 (±0.03) | Not visible (~0.0) |
| **Only Rhs** | ~0.89 (±0.03) | **~0.90 (±0.03)** | ~0.39 (±0.04) | ~0.76 (±0.03) | ~0.24 (±0.03) | ~0.06 (±0.03) | Not visible (~0.0) |
| **Random Finals** | ~0.48 (±0.06) | ~0.06 (±0.03) | ~0.09 (±0.03) | ~0.28 (±0.03) | ~0.35 (±0.03) | ~0.01 (±0.01) | Not visible (~0.0) |
### Key Observations
1. **Human Performance**: Human accuracy (blue bars) is consistently high (≥0.68) across all conditions except "Random Finals," where it drops to ~0.48. It is the top or near-top performer in 6 of 8 conditions.
2. **Model Standouts**:
- **Claude 3 Opus (Red)**: Achieves the single highest accuracy on the chart (~0.99) in the "Permuted Questions" condition. It is also strong in "Defaults" and "Only Rhs."
- **GPT-4 (Orange)**: Matches or exceeds human performance in the "Only Rhs" condition (~0.90 vs ~0.89). It shows a significant performance drop in "Randoms" and "Random Finals."
- **GPT-3 (Green) & Claude 2 (Purple)**: Show moderate performance, generally below GPT-4 and Claude 3 Opus. Claude 2 notably outperforms GPT-3 in most conditions.
3. **Low-Performing Models**: **Falcon-40B (Brown)** and **Pythia-12B-Deduped (Pink)** have very low accuracy across all conditions, with Falcon-40B peaking at ~0.10 and Pythia not registering a visible bar.
4. **Condition Difficulty**: The "Random Finals" condition appears to be the most challenging, causing the largest performance drop for the human and most models. Conversely, "Permuted Questions" and "Only Rhs" seem to be conditions where top models can excel.
5. **Error Bars**: The size of the error bars varies. Conditions like "Random Permuted Pairs" and "Randoms" show larger error bars for the human, suggesting greater variability in performance on those tasks.
### Interpretation
This chart likely presents results from a benchmarking study evaluating reasoning or knowledge recall under different data presentation or perturbation conditions. The conditions ("Permuted Pairs," "Random Finals," etc.) suggest tests of robustness to scrambled inputs, distractors, or altered question formats.
The data demonstrates a clear performance hierarchy: **Human ≈ Claude 3 Opus ≈ GPT-4 > Claude 2 > GPT-3 >> Falcon-40B ≈ Pythia-12B-Deduped**. The exceptional performance of Claude 3 Opus on "Permuted Questions" indicates a specific strength in that type of reasoning task. The fact that GPT-4 matches human performance on "Only Rhs" (possibly "Only Right-hand Sides" of an equation or analogy) suggests it has mastered that particular sub-task.
The dramatic drop in accuracy for all entities on "Random Finals" implies this condition removes a critical structural cue or introduces noise that severely disrupts the reasoning process. The near-zero performance of the smaller models (Falcon-40B, Pythia-12B-Deduped) across the board highlights a significant capability gap between larger, more advanced models and smaller ones on these specific tasks. The chart effectively communicates that model size and architecture (as represented by the different model names) are strong predictors of performance on this benchmark, with human-level performance being attainable by the top models under certain conditions.