## Line Chart: Benchmark: MATH500
### Overview
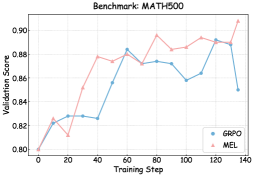
The image displays a line chart comparing the validation score performance of two different methods, labeled "GAPO" and "MEL," over the course of training steps on the MATH500 benchmark. The chart tracks how the validation score for each method evolves as training progresses.
### Components/Axes
* **Chart Title:** "Benchmark: MATH500" (centered at the top).
* **X-Axis:** Labeled "Training Step." The axis is linear and marked with major ticks at intervals of 20, from 0 to 140.
* **Y-Axis:** Labeled "Validation Score." The axis is linear and marked with major ticks at intervals of 0.02, from 0.80 to 0.90.
* **Legend:** Located in the top-left corner of the plot area. It contains two entries:
* A blue line with a circular marker labeled "GAPO".
* A red line with a circular marker labeled "MEL".
* **Data Series:** Two lines with markers at each data point.
* **GAPO (Blue Line):** Represents one method's performance.
* **MEL (Red Line):** Represents the second method's performance.
### Detailed Analysis
**Trend Verification & Data Point Extraction:**
* **GAPO (Blue Line) Trend:** The line shows an overall upward trend with moderate volatility. It starts low, rises quickly, experiences a period of fluctuation between steps 40-100, and then shows a final decline.
* Step 0: ~0.80
* Step 10: ~0.825
* Step 20: ~0.83
* Step 30: ~0.83
* Step 40: ~0.83
* Step 50: ~0.855
* Step 60: ~0.88 (local peak)
* Step 70: ~0.87
* Step 80: ~0.87
* Step 90: ~0.865
* Step 100: ~0.86
* Step 110: ~0.875
* Step 120: ~0.89 (global peak for GAPO)
* Step 130: ~0.885
* Step 140: ~0.85
* **MEL (Red Line) Trend:** The line shows a more volatile but stronger overall upward trend, culminating in the highest score on the chart. It has a notable early dip.
* Step 0: ~0.80
* Step 10: ~0.825
* Step 20: ~0.81 (significant dip)
* Step 30: ~0.84
* Step 40: ~0.875
* Step 50: ~0.875
* Step 60: ~0.87
* Step 70: ~0.88
* Step 80: ~0.89
* Step 90: ~0.88
* Step 100: ~0.885
* Step 110: ~0.885
* Step 120: ~0.89
* Step 130: ~0.885
* Step 140: ~0.91 (global peak for the chart)
### Key Observations
1. **Final Performance:** At the final recorded step (140), MEL (~0.91) significantly outperforms GAPO (~0.85).
2. **Volatility:** MEL exhibits greater volatility, especially in the early training steps (sharp dip at step 20) and the final ascent. GAPO's path is somewhat smoother but still shows fluctuations.
3. **Peak Timing:** GAPO reaches its peak performance earlier (around step 120) before declining. MEL's performance is still climbing at the end of the charted range.
4. **Initial Phase:** Both methods start at the same point (~0.80) and perform similarly for the first 10 steps. They diverge significantly after step 20.
5. **Crossover Points:** The lines cross multiple times (e.g., near steps 10, 60, 70, 110, 120), indicating periods where one method temporarily surpasses the other before the lead changes again.
### Interpretation
The chart suggests a trade-off between stability and peak performance for these two methods on the MATH500 benchmark. **GAPO** appears to be a more stable learner, avoiding major early setbacks but also failing to achieve the highest possible score, with performance degrading after step 120. This could indicate overfitting or a suboptimal learning rate schedule in later stages.
**MEL**, in contrast, demonstrates a "high-risk, high-reward" profile. Its significant early dip suggests initial instability or sensitivity to early training conditions. However, it recovers strongly and ultimately achieves a superior final validation score, indicating it may have a higher capacity for learning or a better optimization trajectory in the long run. The fact that its score is still rising at step 140 implies that further training might yield even better results, whereas GAPO's performance has already peaked and begun to fall.
The multiple crossover points highlight that the "better" method is not constant throughout training; the choice between them could depend on the available training budget (steps) or the need for consistent, predictable improvement versus chasing the absolute highest score.