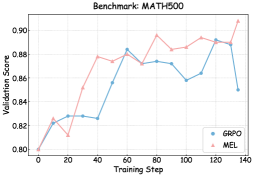
## Line Graph: MATH500 Benchmark Validation Scores
### Overview
The image displays a line graph comparing the validation scores of two optimization methods (GRPO and MEL) across 140 training steps on the MATH500 benchmark. The graph shows fluctuating performance trends with notable divergence between the two methods in later stages.
### Components/Axes
- **X-axis**: Training Step (0 to 140, increments of 20)
- **Y-axis**: Validation Score (0.80 to 0.90, increments of 0.02)
- **Legend**: Located in bottom-right corner
- Blue line: GRPO
- Pink line: MEL
- **Title**: "Benchmark: MATH500" (top-center)
### Detailed Analysis
1. **GRPO (Blue Line)**:
- Starts at 0.80 (training step 0)
- Peaks at 0.88 (training step 60)
- Experiences a sharp dip to 0.85 (training step 100)
- Final score: 0.85 (training step 140)
- Notable volatility between steps 80-120
2. **MEL (Pink Line)**:
- Starts at 0.80 (training step 0)
- Rapid ascent to 0.88 (training step 40)
- Maintains 0.88-0.89 range until step 120
- Final score: 0.90 (training step 140)
- Steady upward trend after step 80
### Key Observations
- MEL consistently outperforms GRPO after training step 60
- GRPO shows significant instability between steps 80-100
- Both methods start with identical performance at step 0
- MEL achieves 0.05 higher validation score than GRPO by final step
- GRPO's peak occurs earlier (step 60) vs MEL's sustained high performance
### Interpretation
The data suggests MEL demonstrates superior optimization stability and final performance on the MATH500 benchmark. The GRPO method's mid-training dip (step 100) indicates potential overfitting or parameter instability, while MEL's gradual ascent suggests more robust convergence properties. The 0.05 score difference at final step highlights MEL's effectiveness in maintaining high validation performance through extended training. This pattern aligns with MEL's theoretical advantages in gradient estimation for complex optimization landscapes.