## Chart: Difference in Log Probabilities vs. Number of Layers
### Overview
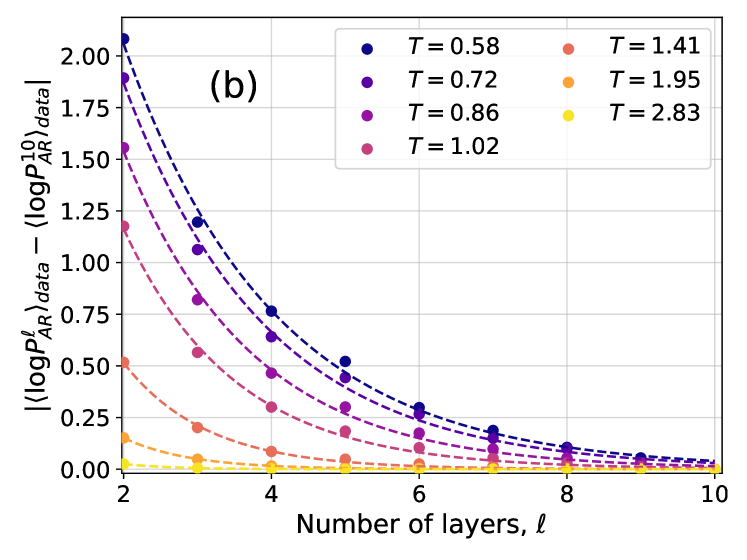
The image presents a line chart illustrating the difference between the log probability of the area ratio (logP<sup>l</sup><sub>AR</sub>) data and a reference value, plotted against the number of layers (ℓ). Multiple lines represent different values of a parameter 'T'. Error bars are present for each data point, indicating the uncertainty in the measurements.
### Components/Axes
* **X-axis:** Number of layers (ℓ), ranging from approximately 2 to 10. Labeled as "Number of layers, ℓ".
* **Y-axis:** Difference in log probabilities: ⟨logP<sup>l</sup><sub>AR</sub> data - ⟨logP<sup>l</sup><sub>AR</sub>⟩data⟩, ranging from approximately 0 to 2. Labeled as "⟨logP<sup>l</sup><sub>AR</sub> data - ⟨logP<sup>l</sup><sub>AR</sub>⟩data⟩".
* **Legend:** Located in the top-right corner, listing the values of 'T' corresponding to each line:
* T = 0.58 (Dark Blue)
* T = 0.72 (Medium Blue)
* T = 0.86 (Purple)
* T = 1.02 (Magenta)
* T = 1.41 (Red)
* T = 1.95 (Orange)
* T = 2.83 (Yellow)
* **Title:** "(b)" located in the top-left corner.
### Detailed Analysis
The chart displays seven distinct lines, each representing a different value of 'T'. All lines exhibit a decreasing trend as the number of layers (ℓ) increases. The initial values and rates of decrease vary significantly between the lines.
* **T = 0.58 (Dark Blue):** The line starts at approximately 1.85 at ℓ = 2 and decreases rapidly, approaching 0 around ℓ = 8. Error bars are visible and relatively large at lower ℓ values, decreasing as ℓ increases.
* **T = 0.72 (Medium Blue):** Starts at approximately 1.55 at ℓ = 2, decreasing more slowly than T = 0.58. Approaches 0 around ℓ = 9. Error bars are similar in size to T = 0.58.
* **T = 0.86 (Purple):** Starts at approximately 1.2 at ℓ = 2, decreasing at a rate between T = 0.72 and T = 1.02. Approaches 0 around ℓ = 9. Error bars are similar in size to T = 0.58.
* **T = 1.02 (Magenta):** Starts at approximately 0.85 at ℓ = 2, decreasing at a slower rate than the previous lines. Approaches 0 around ℓ = 9. Error bars are similar in size to T = 0.58.
* **T = 1.41 (Red):** Starts at approximately 0.3 at ℓ = 2, and decreases slowly. Approaches 0 around ℓ = 6. Error bars are relatively small.
* **T = 1.95 (Orange):** Starts at approximately 0.15 at ℓ = 2, and decreases very slowly. Approaches 0 around ℓ = 6. Error bars are relatively small.
* **T = 2.83 (Yellow):** Starts at approximately 0.05 at ℓ = 2, and remains close to 0 throughout the plotted range. Error bars are relatively small.
### Key Observations
* The difference in log probabilities decreases with increasing number of layers for all values of 'T'.
* Lower values of 'T' (0.58, 0.72, 0.86, 1.02) exhibit a more significant initial difference and a more pronounced decrease compared to higher values of 'T' (1.41, 1.95, 2.83).
* The error bars suggest greater uncertainty in the measurements for lower values of 'T' and at smaller values of ℓ.
* The lines for T = 1.95 and T = 2.83 are consistently close to zero, indicating a minimal difference in log probabilities for these values of 'T'.
### Interpretation
This chart likely represents the convergence of a model or algorithm as the number of layers increases. The parameter 'T' could represent a control parameter or a characteristic of the input data. The decreasing trend suggests that as the number of layers increases, the model's output becomes more consistent or approaches a stable state. The different lines for different values of 'T' indicate that the convergence rate and initial difference are sensitive to the value of 'T'.
The larger error bars for lower 'T' values suggest that the model is more sensitive to variations in the input data or initial conditions when 'T' is small. The fact that the lines for higher 'T' values are closer to zero and have smaller error bars suggests that the model is more robust and converges more quickly for these values of 'T'. The chart demonstrates a clear relationship between the parameter 'T', the number of layers, and the difference in log probabilities, providing insights into the behavior and convergence properties of the underlying model.