## Line Graph: Head Influence Curves (Qwen3-4B; LongHealth)
### Overview
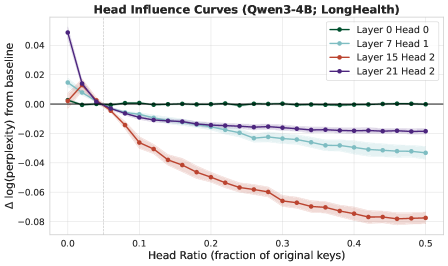
The graph illustrates the relationship between "Head Ratio" (fraction of original keys) and "Δ log(perplexity) from baseline" for four specific attention heads in the Qwen3-4B model. Four lines represent different layers and heads, showing how reducing the number of keys affects model performance.
### Components/Axes
- **X-axis**: Head Ratio (fraction of original keys), ranging from 0.0 to 0.5 in increments of 0.05.
- **Y-axis**: Δ log(perplexity) from baseline, ranging from -0.08 to 0.04 in increments of 0.02.
- **Legend**: Located in the top-right corner, mapping colors to layers/heads:
- Green: Layer 0 Head 0
- Light Blue: Layer 7 Head 1
- Red: Layer 15 Head 2
- Purple: Layer 21 Head 2
### Detailed Analysis
1. **Layer 0 Head 0 (Green)**:
- Remains nearly flat at Δ log(perplexity) ≈ 0.00 across all Head Ratios.
- No significant deviation from baseline.
2. **Layer 7 Head 1 (Light Blue)**:
- Starts slightly above baseline (Δ ≈ 0.01 at Head Ratio 0.0).
- Gradually declines to Δ ≈ -0.02 by Head Ratio 0.5.
- Slope: Approximately linear decrease.
3. **Layer 15 Head 2 (Red)**:
- Begins at baseline (Δ ≈ 0.00 at Head Ratio 0.0).
- Sharp drop to Δ ≈ -0.04 at Head Ratio 0.1.
- Continues declining to Δ ≈ -0.08 by Head Ratio 0.5.
- Slope: Steeper than Layer 7 Head 1.
4. **Layer 21 Head 2 (Purple)**:
- Starts at Δ ≈ 0.04 at Head Ratio 0.0.
- Rapid decline to Δ ≈ -0.02 at Head Ratio 0.1.
- Stabilizes near Δ ≈ -0.02 for Head Ratios ≥ 0.2.
- Slope: Steepest initial drop, then plateau.
### Key Observations
- **Layer 0 Head 0** shows no sensitivity to key reduction, suggesting minimal influence on perplexity.
- **Layer 21 Head 2** exhibits the most dramatic initial performance drop, indicating critical reliance on full key sets.
- **Layer 15 Head 2** demonstrates the largest overall decline, suggesting higher vulnerability to key reduction.
- All lines except Layer 0 Head 0 show negative Δ log(perplexity), implying reduced model performance with fewer keys.
### Interpretation
The data suggests that higher layers (e.g., Layer 21) and specific heads (e.g., Head 2) are more sensitive to reductions in attention key counts. The sharp initial drop in Layer 21 Head 2 implies these components may rely heavily on full key interactions for optimal performance. The stability of Layer 0 Head 0 indicates it may operate independently of key quantity, possibly handling less critical tasks. These trends highlight architectural trade-offs in attention mechanisms, where certain heads/layers are more critical to model efficacy than others.