## Heatmap: Accuracy
### Overview
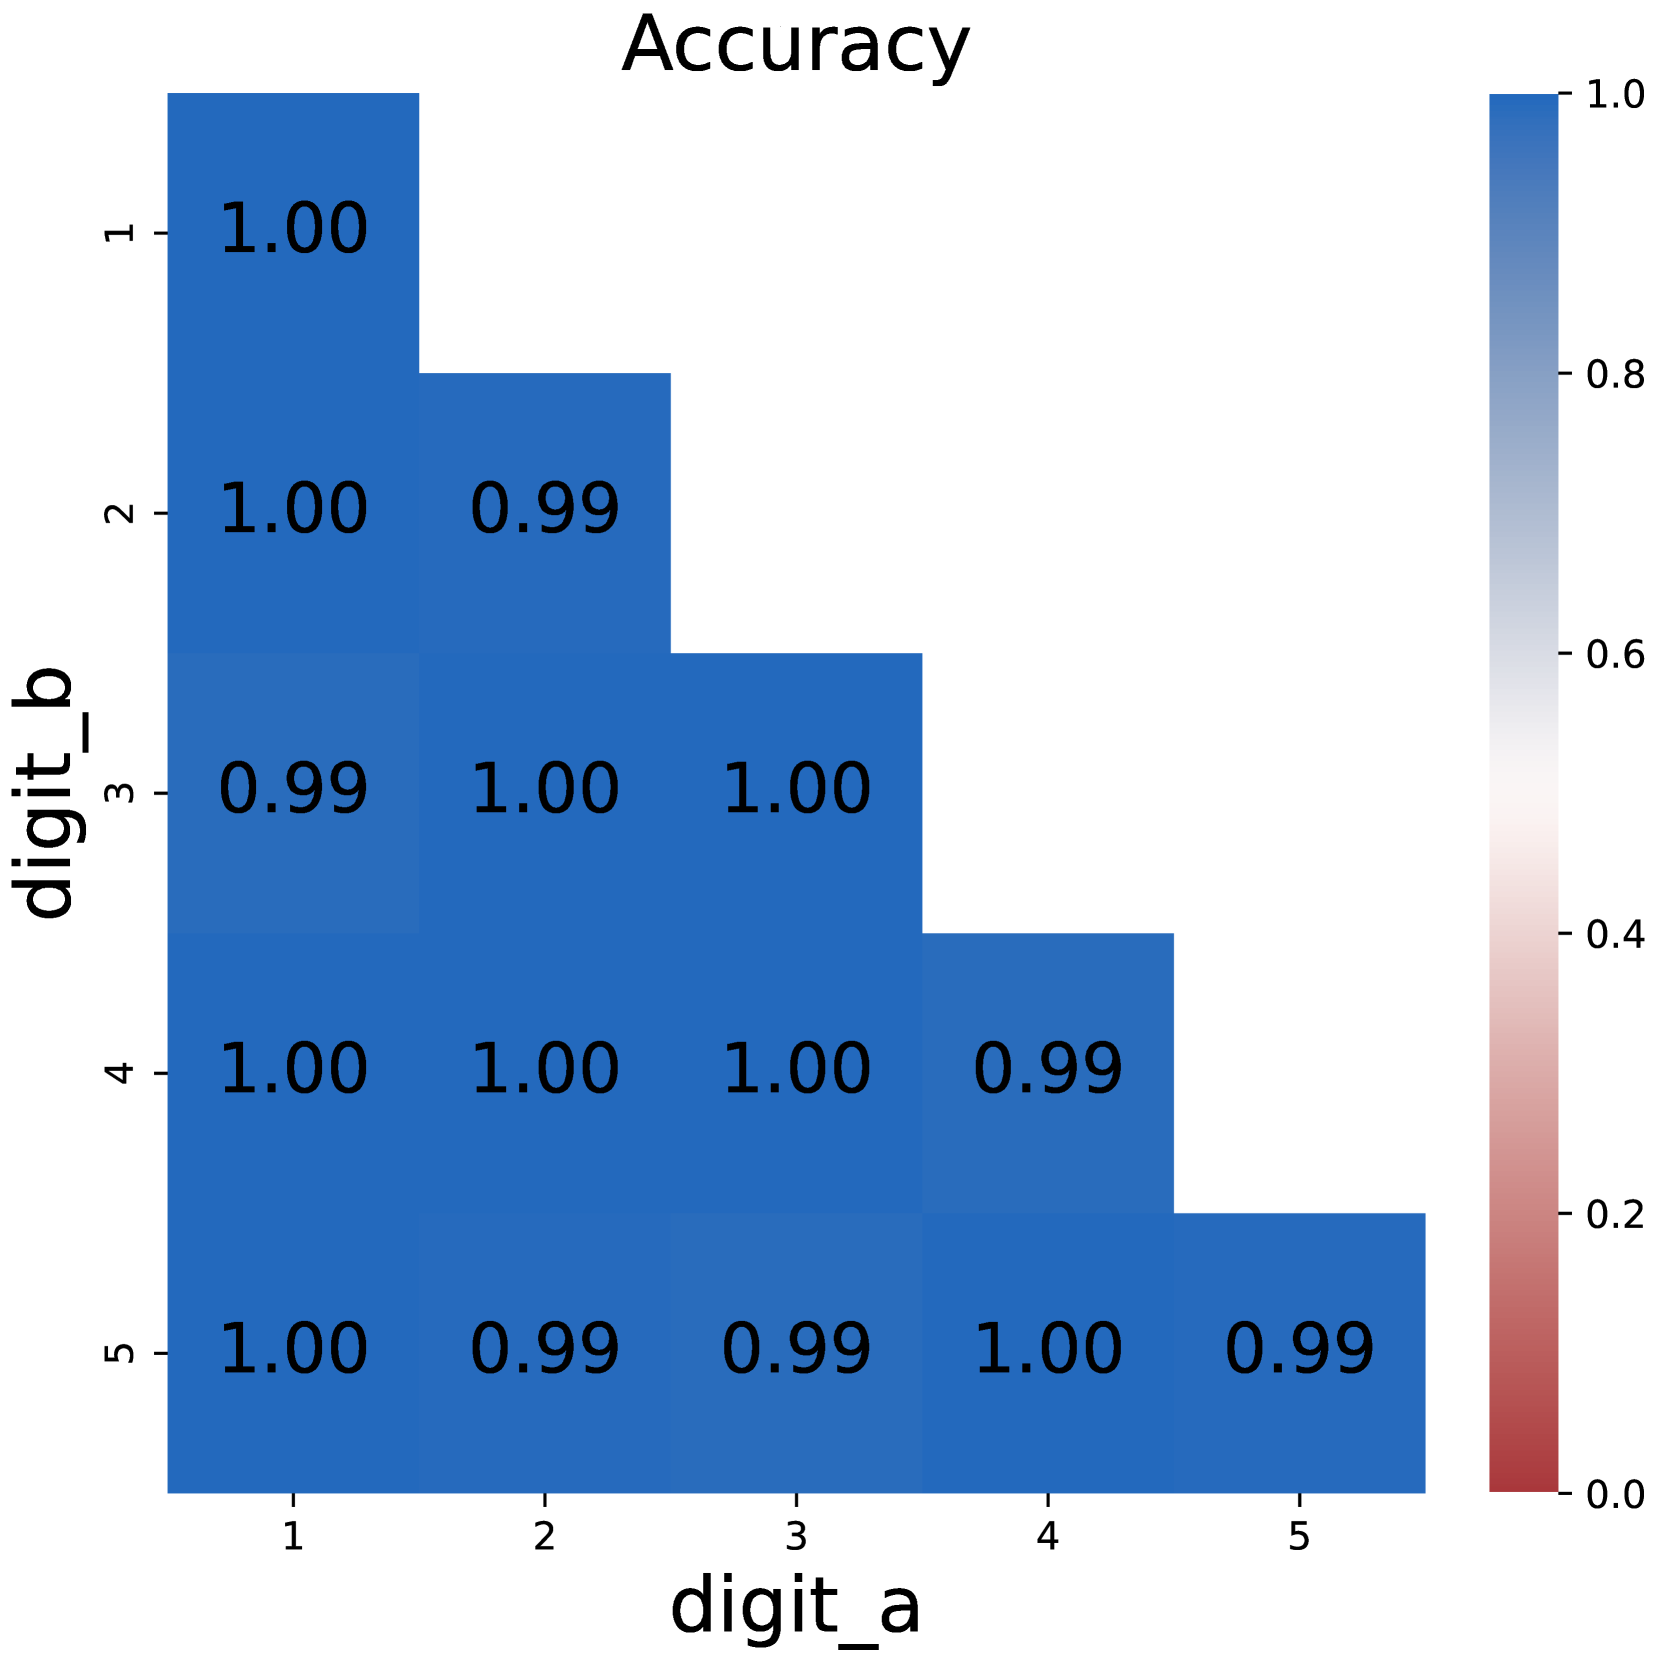
This image presents a heatmap visualizing the accuracy of a system, likely a digit recognition model, in predicting digit 'b' given digit 'a'. The heatmap displays accuracy values ranging from 0.0 to 1.0, with darker blue shades representing higher accuracy. The heatmap is a 5x5 grid, representing the accuracy for each possible pair of digits from 1 to 5.
### Components/Axes
* **Title:** "Accuracy" - positioned at the top-center of the image.
* **X-axis Label:** "digit\_a" - positioned at the bottom-center of the image. The axis markers are 1, 2, 3, 4, and 5.
* **Y-axis Label:** "digit\_b" - positioned at the left-center of the image. The axis markers are 1, 2, 3, 4, and 5.
* **Colorbar:** A vertical colorbar is located on the right side of the heatmap. It ranges from approximately 0.0 (red) to 1.0 (dark blue), representing the accuracy scale.
* **Data Cells:** Each cell in the 5x5 grid represents the accuracy for a specific (digit\_a, digit\_b) pair. The accuracy value is displayed within each cell.
### Detailed Analysis
The heatmap shows predominantly high accuracy values, mostly close to 1.0. Let's analyze each cell:
* **(1, 1):** Accuracy = 1.00
* **(1, 2):** Accuracy = 1.00
* **(1, 3):** Accuracy = 0.99
* **(1, 4):** Accuracy = 1.00
* **(1, 5):** Accuracy = 1.00
* **(2, 1):** Accuracy = 1.00
* **(2, 2):** Accuracy = 0.99
* **(2, 3):** Accuracy = 1.00
* **(2, 4):** Accuracy = 1.00
* **(2, 5):** Accuracy = 0.99
* **(3, 1):** Accuracy = 0.99
* **(3, 2):** Accuracy = 1.00
* **(3, 3):** Accuracy = 1.00
* **(3, 4):** Accuracy = 1.00
* **(3, 5):** Accuracy = 0.99
* **(4, 1):** Accuracy = 1.00
* **(4, 2):** Accuracy = 1.00
* **(4, 3):** Accuracy = 1.00
* **(4, 4):** Accuracy = 0.99
* **(4, 5):** Accuracy = 0.99
* **(5, 1):** Accuracy = 1.00
* **(5, 2):** Accuracy = 0.99
* **(5, 3):** Accuracy = 0.99
* **(5, 4):** Accuracy = 1.00
* **(5, 5):** Accuracy = 0.99
The values generally decrease as the digits 'a' and 'b' become further apart.
### Key Observations
* The highest accuracy (1.00) is observed for several digit pairs, indicating strong performance in those specific predictions.
* The lowest accuracy values (0.99) are scattered throughout the heatmap, suggesting a slight decrease in performance for certain digit combinations.
* The heatmap exhibits a generally consistent pattern of high accuracy, with only minor variations.
* There is no clear diagonal pattern, suggesting that the model does not have a bias towards predicting the same digit.
### Interpretation
The heatmap demonstrates that the digit recognition system achieves very high accuracy across most digit pairs (1-5). The values consistently hover around 1.0, indicating a robust and reliable model. The slight dips to 0.99 suggest that the model may struggle slightly with certain digit combinations, but the overall performance remains excellent.
The heatmap provides a clear visual representation of the model's performance, allowing for quick identification of areas where the model excels or may require further improvement. The data suggests that the model is well-trained and capable of accurately predicting digits in most scenarios. The consistent high accuracy across the board indicates a well-generalized model, not overly sensitive to specific input combinations.