## Donut Chart: KGoT Tool Usage Distribution
### Overview
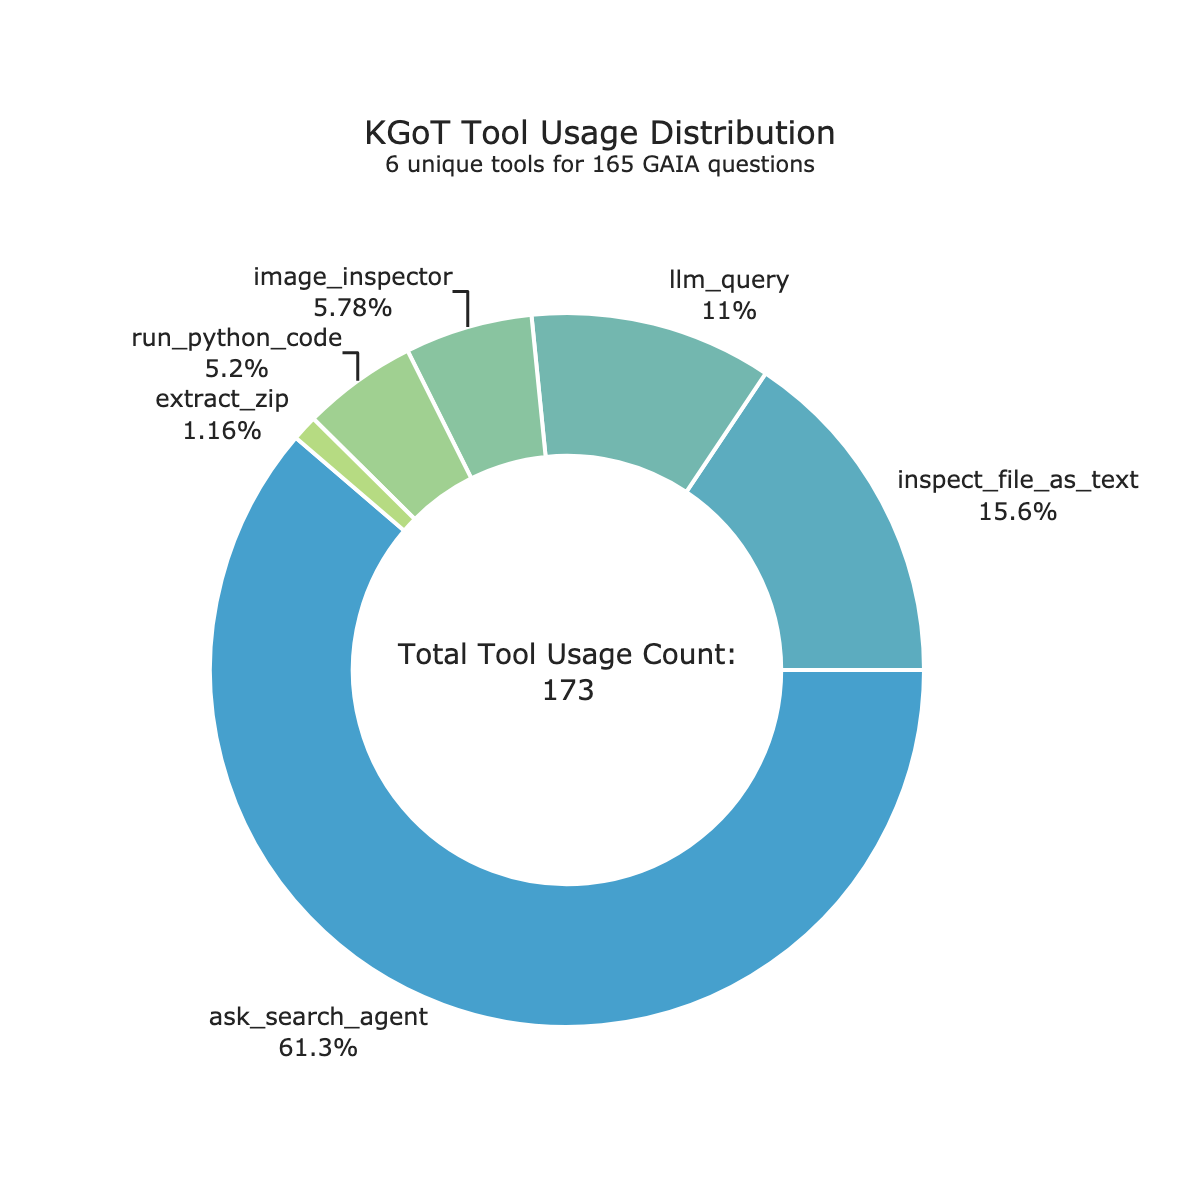
The image displays a donut chart titled "KGoT Tool Usage Distribution" with the subtitle "6 unique tools for 165 GAIA questions." The chart visualizes the proportional usage of six different tools, with the total usage count displayed in the center. The overall aesthetic uses a cool color palette of blues and greens against a white background.
### Components/Axes
* **Chart Type:** Donut Chart (a pie chart with a central hole).
* **Title:** "KGoT Tool Usage Distribution"
* **Subtitle:** "6 unique tools for 165 GAIA questions"
* **Central Label:** "Total Tool Usage Count: 173"
* **Data Series (Segments):** The chart is divided into six segments, each representing a tool. The segments are labeled directly with the tool name and its percentage of the total usage. There is no separate legend; labels are placed adjacent to their corresponding segments.
* **Color Scheme:** The segments use a gradient from a dominant medium blue for the largest segment to progressively lighter shades of teal and green for the smaller segments.
### Detailed Analysis
The chart presents the following data, ordered from the largest segment to the smallest:
1. **ask_search_agent**
* **Color:** Medium blue.
* **Placement:** Occupies the entire bottom half and a portion of the upper right quadrant of the donut. It is the visually dominant segment.
* **Percentage:** 61.3%
* **Trend:** This is the most frequently used tool by a significant margin.
2. **inspect_file_as_text**
* **Color:** Teal blue.
* **Placement:** Located in the upper right quadrant, adjacent to the `ask_search_agent` segment.
* **Percentage:** 15.6%
* **Trend:** The second most used tool.
3. **llm_query**
* **Color:** Light teal.
* **Placement:** Located in the upper center, adjacent to `inspect_file_as_text`.
* **Percentage:** 11%
* **Trend:** The third most used tool.
4. **image_inspector**
* **Color:** Light green.
* **Placement:** Located in the upper left quadrant, adjacent to `llm_query`.
* **Percentage:** 5.78%
* **Trend:** Usage drops significantly here.
5. **run_python_code**
* **Color:** Lighter green.
* **Placement:** Located in the upper left quadrant, adjacent to `image_inspector`.
* **Percentage:** 5.2%
* **Trend:** Very similar in usage to `image_inspector`.
6. **extract_zip**
* **Color:** Pale green.
* **Placement:** A very thin sliver in the upper left quadrant, adjacent to `run_python_code`.
* **Percentage:** 1.16%
* **Trend:** The least used tool by a wide margin.
**Data Verification:** The sum of the percentages (61.3 + 15.6 + 11 + 5.78 + 5.2 + 1.16) equals 100.04%, which is within an acceptable rounding margin. The central label states a total count of 173 tool usages across 165 questions, indicating an average of approximately 1.05 tool uses per question.
### Key Observations
* **Dominant Tool:** The `ask_search_agent` tool is overwhelmingly dominant, accounting for nearly two-thirds (61.3%) of all tool invocations.
* **Usage Concentration:** The top three tools (`ask_search_agent`, `inspect_file_as_text`, `llm_query`) collectively account for 87.9% of all usage.
* **Minimal Tools:** The `extract_zip` tool is used very infrequently (1.16%), suggesting it is either a specialized tool for rare cases or potentially underutilized.
* **Total Count Discrepancy:** The total tool usage count (173) is slightly higher than the number of questions (165), implying that some questions required the use of more than one tool.
### Interpretation
This chart provides a clear quantitative breakdown of tool utilization within the KGoT system for the GAIA benchmark. The data strongly suggests that the system's problem-solving strategy is heavily reliant on a search agent (`ask_search_agent`). This could indicate that retrieving and synthesizing information from external sources is the primary mode of operation for the tasks in the GAIA dataset.
The secondary reliance on file inspection tools (`inspect_file_as_text`, `image_inspector`) and direct LLM queries (`llm_query`) points to a workflow that often involves analyzing provided documents or files and using the language model's internal knowledge. The very low usage of `run_python_code` and `extract_zip` suggests that tasks requiring computational execution or handling of compressed archives are rare in this specific evaluation set.
The distribution is highly skewed, which is a notable pattern. It raises questions about the nature of the GAIA questions: are they predominantly research and retrieval tasks? It also suggests that optimizing the performance and reliability of the `ask_search_agent` would yield the greatest overall system improvement for this benchmark. The near-negligible use of `extract_zip` might warrant investigation to determine if it's a tool in search of a problem or if the benchmark simply lacks scenarios that require it.