\n
## Chart: Token Frequency Distribution - Question vs. Answer
### Overview
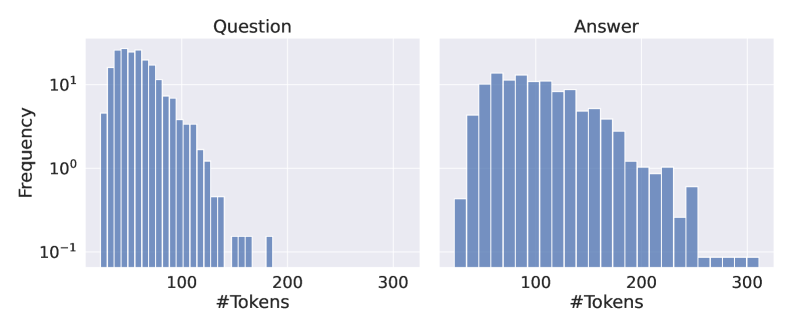
The image presents two histograms displayed side-by-side. Both histograms represent the frequency distribution of the number of tokens in a dataset. The left histogram represents the distribution for "Question" data, and the right histogram represents the distribution for "Answer" data. Both y-axes are on a logarithmic scale.
### Components/Axes
* **X-axis Label (Both Charts):** "#Tokens" - Represents the number of tokens. Scale ranges from approximately 0 to 300.
* **Y-axis Label (Both Charts):** "Frequency" - Represents the number of occurrences of a given number of tokens. The scale is logarithmic, ranging from approximately 10<sup>-1</sup> to 10<sup>1</sup>.
* **Chart Titles:**
* Left Chart: "Question"
* Right Chart: "Answer"
* **Histogram Bars:** Each bar represents the frequency of a specific number of tokens.
### Detailed Analysis
**Question Histogram:**
The "Question" histogram shows a distribution that is heavily skewed to the left. The highest frequency occurs around 80-100 tokens. The frequency decreases as the number of tokens increases.
* Approximately 15 tokens have a frequency of around 8.
* Approximately 100 tokens have a frequency of around 4.
* Approximately 150 tokens have a frequency of around 1.
* Approximately 200 tokens have a frequency of around 0.3.
* Approximately 250 tokens have a frequency of around 0.1.
* Approximately 300 tokens have a frequency of around 0.03.
**Answer Histogram:**
The "Answer" histogram also shows a distribution skewed to the left, but it appears to be slightly more spread out than the "Question" histogram. The peak frequency occurs around 120-140 tokens.
* Approximately 100 tokens have a frequency of around 7.
* Approximately 150 tokens have a frequency of around 5.
* Approximately 200 tokens have a frequency of around 2.
* Approximately 250 tokens have a frequency of around 0.5.
* Approximately 300 tokens have a frequency of around 0.1.
### Key Observations
* Both distributions are right-skewed, indicating that most questions and answers have a relatively small number of tokens, with fewer instances of longer questions or answers.
* The peak of the "Question" distribution is slightly to the left of the peak of the "Answer" distribution, suggesting that questions tend to be shorter than answers on average.
* The logarithmic scale on the y-axis emphasizes the differences in frequency for lower token counts.
### Interpretation
The data suggests that the length of questions and answers in the dataset varies, but there's a tendency for questions to be shorter than answers. The skewed distributions indicate that a small number of very long questions or answers exist, but they are relatively rare compared to shorter ones. This information could be useful for tasks such as optimizing language model input lengths or understanding the complexity of the question-answering task. The logarithmic scale is used to better visualize the frequency of the more common, shorter token lengths, as the frequency drops off rapidly for longer token counts. The distributions provide insight into the characteristics of the text data used for question answering.