## Line Chart: Test AUROC vs. k-top Eigenvalues for Different Metrics
### Overview
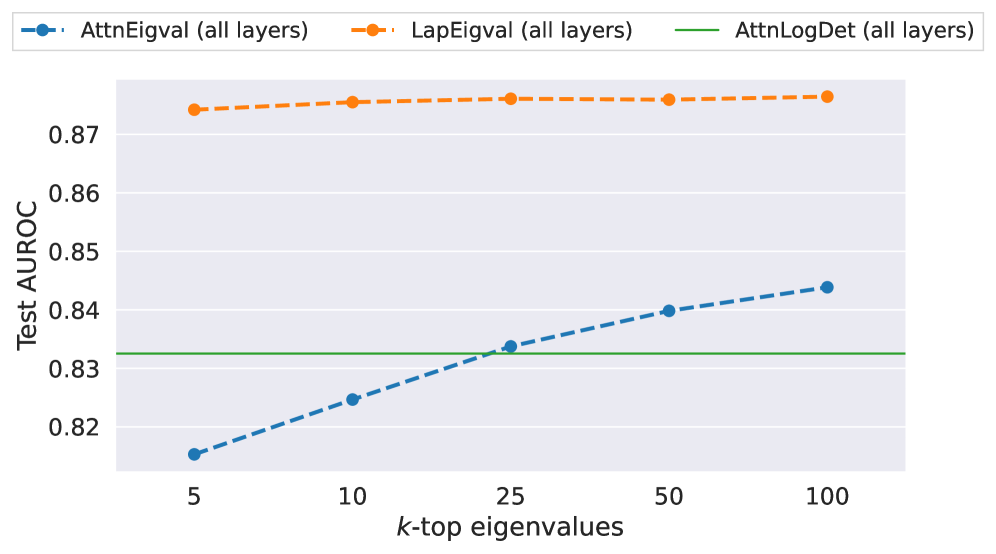
The image displays a line chart comparing the performance (Test AUROC) of three different metrics as a function of the number of top eigenvalues (`k`) considered. The chart suggests an evaluation of model performance or anomaly detection capability, likely in a machine learning or signal processing context, using spectral properties of attention or Laplacian matrices.
### Components/Axes
* **Chart Type:** Line chart with markers.
* **X-Axis:**
* **Label:** `k-top eigenvalues`
* **Scale:** Categorical/ordinal with discrete markers at values: 5, 10, 25, 50, 100.
* **Y-Axis:**
* **Label:** `Test AUROC`
* **Scale:** Linear, ranging from approximately 0.82 to 0.87. The axis does not start at zero.
* **Legend:** Positioned at the top center of the chart area.
1. `AttnEigval (all layers)`: Represented by a blue dashed line (`--`) with circular markers.
2. `LapEigval (all layers)`: Represented by an orange dashed line (`--`) with circular markers.
3. `AttnLogDet (all layers)`: Represented by a solid green line (`-`).
### Detailed Analysis
**1. AttnEigval (all layers) - Blue Dashed Line:**
* **Trend:** Shows a clear, consistent upward slope. Performance improves as `k` increases.
* **Data Points (Approximate):**
* k=5: AUROC ≈ 0.815
* k=10: AUROC ≈ 0.825
* k=25: AUROC ≈ 0.833
* k=50: AUROC ≈ 0.840
* k=100: AUROC ≈ 0.844
**2. LapEigval (all layers) - Orange Dashed Line:**
* **Trend:** Nearly flat, with a very slight upward slope. Performance is consistently high and stable across all values of `k`.
* **Data Points (Approximate):**
* k=5: AUROC ≈ 0.874
* k=10: AUROC ≈ 0.875
* k=25: AUROC ≈ 0.876
* k=50: AUROC ≈ 0.876
* k=100: AUROC ≈ 0.877
**3. AttnLogDet (all layers) - Green Solid Line:**
* **Trend:** Perfectly horizontal. Performance is constant and independent of the value of `k`.
* **Data Point:** Constant AUROC ≈ 0.833 across all `k`.
### Key Observations
1. **Performance Hierarchy:** `LapEigval` consistently achieves the highest Test AUROC (~0.874-0.877), followed by `AttnLogDet` (~0.833), and then `AttnEigval` which starts lowest but improves.
2. **Sensitivity to `k`:**
* `AttnEigval` is highly sensitive to `k`, showing significant improvement (≈0.029 increase) as more eigenvalues are included.
* `LapEigval` is largely insensitive to `k`, with only a marginal improvement (≈0.003 increase).
* `AttnLogDet` is completely insensitive to `k`.
3. **Crossover Point:** The `AttnEigval` line surpasses the constant `AttnLogDet` line between `k=10` and `k=25`. At `k=25`, their performance is approximately equal (~0.833).
### Interpretation
The chart compares the efficacy of using different spectral features from a model's layers for a test task (likely anomaly detection or classification, given the AUROC metric).
* **LapEigval (Laplacian Eigenvalues)** appears to be the most robust and informative feature. Its high, stable performance suggests that the spectral properties of the graph Laplacian (possibly derived from attention maps or another structure) capture discriminative information effectively, even when only the very top eigenvalues (`k=5`) are used. This could indicate that the most significant structural patterns are concentrated in the leading eigenvalues.
* **AttnEigval (Attention Eigenvalues)** benefits from including more spectral components. Its rising trend implies that while the top eigenvalues are informative, additional signal is contained in the subsequent eigenvalues (up to at least `k=100`). The fact that it starts below `AttnLogDet` but surpasses it suggests a trade-off: with few components, it's less effective than a log-determinant, but with more components, it becomes superior.
* **AttnLogDet (Attention Log-Determinant)** serves as a stable baseline. Its constant value indicates it is a summary statistic (like the log of the product of all eigenvalues) that does not depend on a truncated `k`. It provides decent performance but is outperformed by the more nuanced, `k`-dependent methods when sufficient components are used.
**Overall Implication:** For the task measured, analyzing the eigenvalue spectrum of the Laplacian (`LapEigval`) is the most effective approach, offering top-tier performance with minimal need for parameter tuning (`k`). If using attention eigenvalues (`AttnEigval`), selecting a larger `k` (e.g., 50 or 100) is beneficial. The log-determinant (`AttnLogDet`) is a simple, stable alternative that doesn't require choosing `k`.