## Line Graph: Pass@1 (%) vs. Number of Alternative Tokens
### Overview
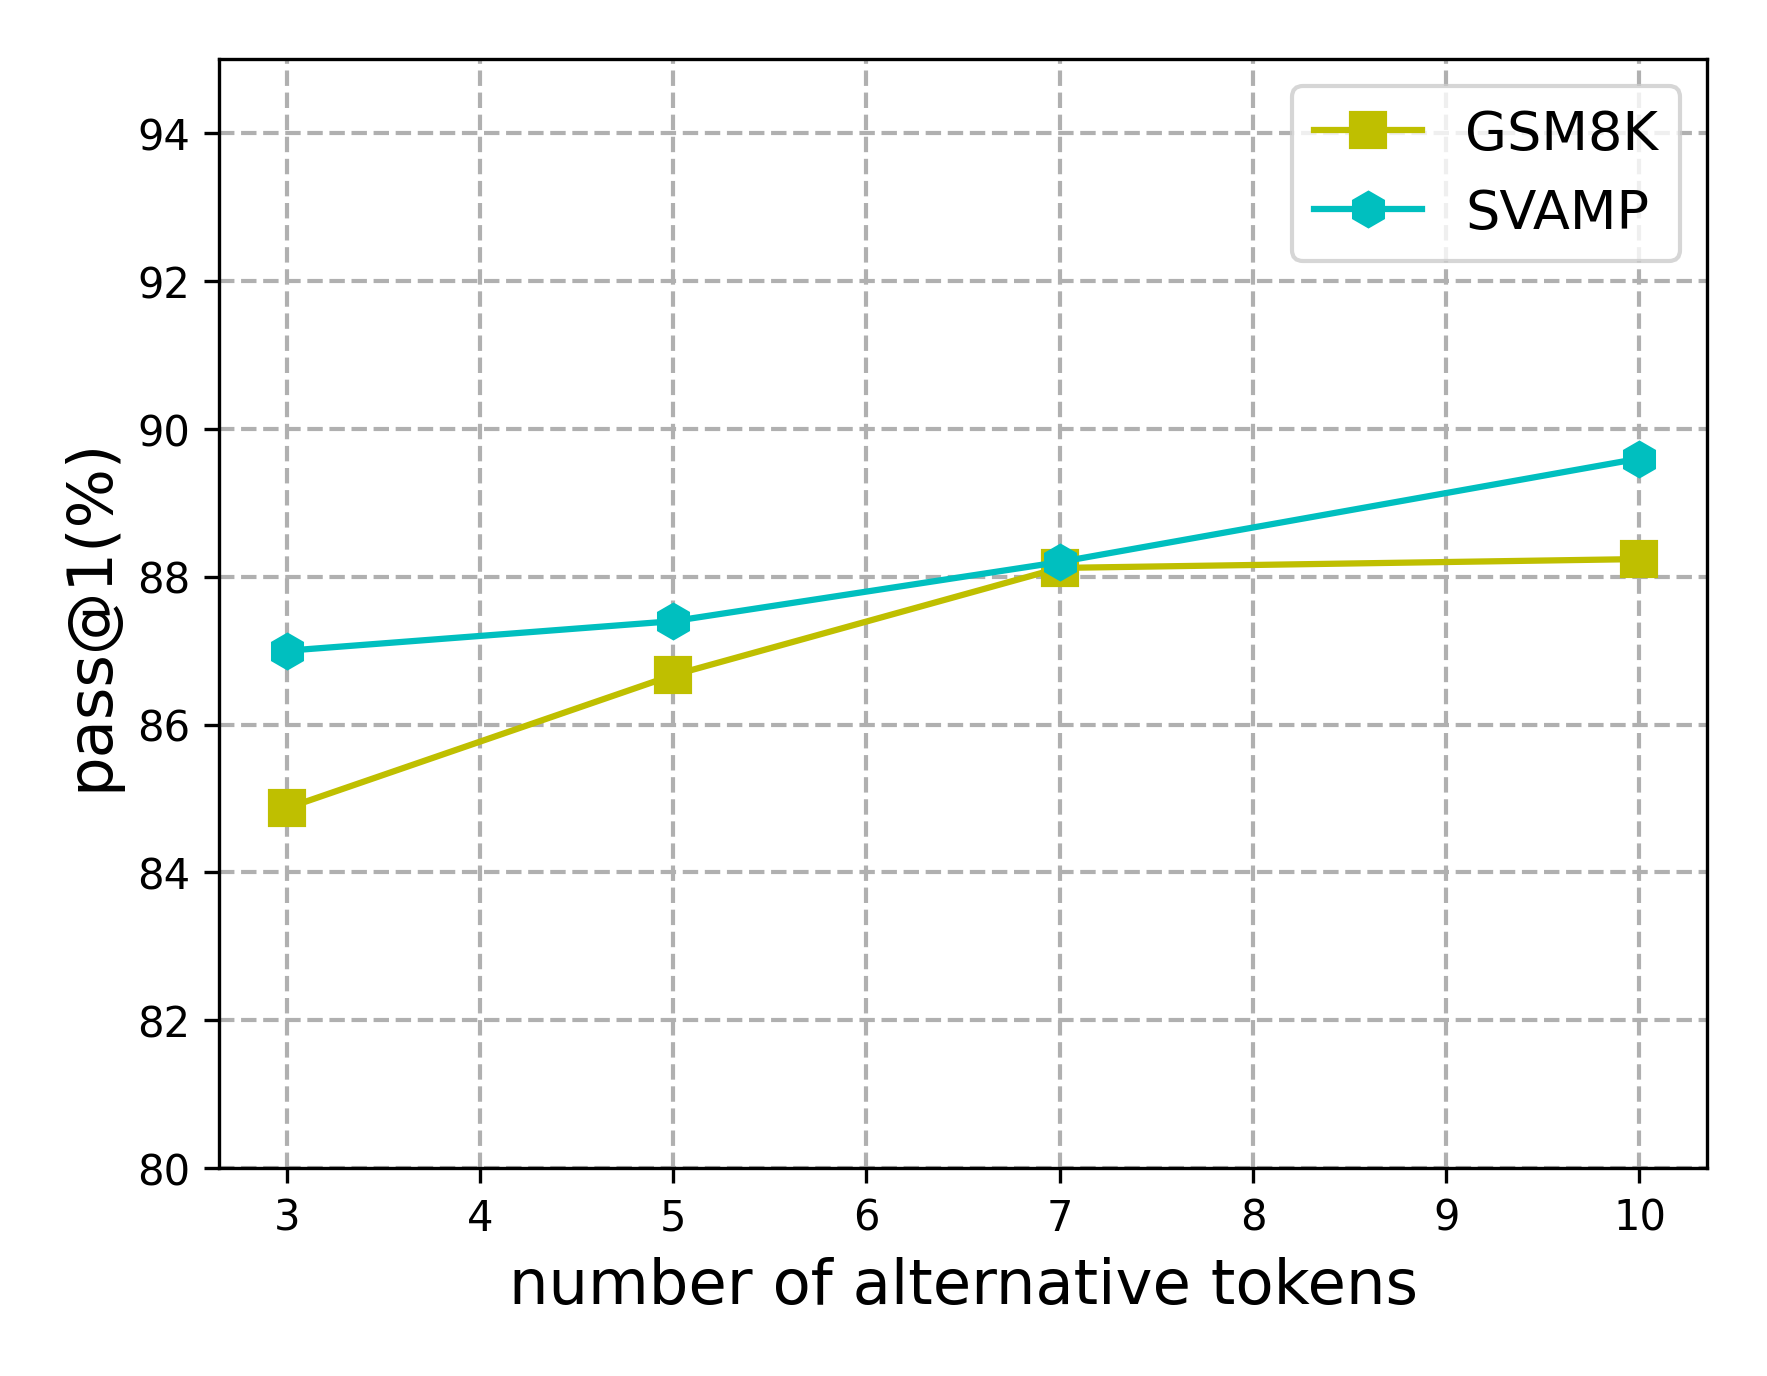
The image is a line graph comparing the performance of two systems, **GSM8K** and **SVAMP**, in terms of **pass@1 (%)** as the number of **alternative tokens** increases from 3 to 10. The graph uses two distinct data series with markers and trend lines.
### Components/Axes
- **X-axis**: "number of alternative tokens" (integer values from 3 to 10).
- **Y-axis**: "pass@1(%)" (percentage values from 80 to 94).
- **Legend**: Located in the top-right corner, with:
- **GSM8K**: Yellow square marker.
- **SVAMP**: Cyan hexagon marker.
### Detailed Analysis
- **GSM8K (Yellow)**:
- At 3 tokens: ~85% pass@1.
- At 10 tokens: ~88% pass@1.
- Trend: Gradual upward slope, with a slight plateau between 7 and 10 tokens.
- **SVAMP (Cyan)**:
- At 3 tokens: ~87% pass@1.
- At 10 tokens: ~89.5% pass@1.
- Trend: Steeper upward slope compared to GSM8K, maintaining a consistent lead throughout.
### Key Observations
1. **SVAMP outperforms GSM8K** across all token counts, with a ~2–3% higher pass@1 rate.
2. Both systems show **improving performance** as the number of alternative tokens increases.
3. **GSM8K’s growth slows** after 7 tokens, while SVAMP’s improvement remains steady.
### Interpretation
The data suggests that **SVAMP is more effective** than GSM8K in handling tasks with increasing numbers of alternative tokens, as evidenced by its consistently higher pass@1 rates. The steeper slope of SVAMP’s line indicates better scalability or efficiency in processing additional tokens. This could imply that SVAMP’s architecture or methodology is better suited for complex token-based tasks. No outliers or anomalies are observed in the trends.