## Chart: R1-Qwen | AIME25 Accuracy vs. Ratio
### Overview
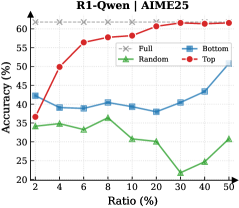
The image is a line chart comparing the accuracy of different models (Full, Random, Bottom, Top) against varying ratios. The x-axis represents the ratio in percentage, and the y-axis represents the accuracy in percentage.
### Components/Axes
* **Title:** R1-Qwen | AIME25
* **X-axis:** Ratio (%) with markers at 2, 4, 6, 8, 10, 20, 30, 40, and 50.
* **Y-axis:** Accuracy (%) with markers at 20, 25, 30, 35, 40, 45, 50, 55, and 60.
* **Legend:** Located at the top-right of the chart.
* Full (Gray dashed line with x markers)
* Random (Green line with triangle markers)
* Bottom (Blue line with square markers)
* Top (Red line with circle markers)
### Detailed Analysis
* **Full (Gray dashed line with x markers):** The accuracy is relatively constant at approximately 62% across all ratios.
* Ratio 2%: ~62%
* Ratio 50%: ~62%
* **Random (Green line with triangle markers):** The accuracy fluctuates, generally decreasing as the ratio increases.
* Ratio 2%: ~37%
* Ratio 8%: ~37%
* Ratio 20%: ~30%
* Ratio 50%: ~31%
* **Bottom (Blue line with square markers):** The accuracy initially decreases, then increases as the ratio increases.
* Ratio 2%: ~43%
* Ratio 4%: ~39%
* Ratio 10%: ~41%
* Ratio 20%: ~38%
* Ratio 40%: ~44%
* Ratio 50%: ~51%
* **Top (Red line with circle markers):** The accuracy increases sharply initially, then plateaus as the ratio increases.
* Ratio 2%: ~38%
* Ratio 4%: ~50%
* Ratio 6%: ~57%
* Ratio 10%: ~58%
* Ratio 30%: ~62%
* Ratio 50%: ~62%
### Key Observations
* The "Full" model consistently maintains the highest accuracy across all ratios.
* The "Top" model shows a significant initial increase in accuracy but plateaus at higher ratios.
* The "Random" model exhibits the lowest and most fluctuating accuracy.
* The "Bottom" model shows an initial dip in accuracy, followed by a gradual increase.
### Interpretation
The chart compares the accuracy of different models (Full, Random, Bottom, Top) at various ratios. The "Full" model, which likely represents the complete dataset or a fully trained model, consistently outperforms the other models. The "Top" model shows promise with a rapid initial increase in accuracy, suggesting that focusing on the top-ranked data points can be effective up to a certain ratio. The "Random" model's poor performance indicates that random sampling is not an effective strategy. The "Bottom" model's behavior suggests that focusing on the bottom-ranked data points may have some value, especially at higher ratios. The data suggests that strategic data selection or weighting can significantly impact model accuracy, with the "Full" model serving as the benchmark for optimal performance.