## Line Chart: NDCG@10 vs. Embedding Dimensions for Different Models
### Overview
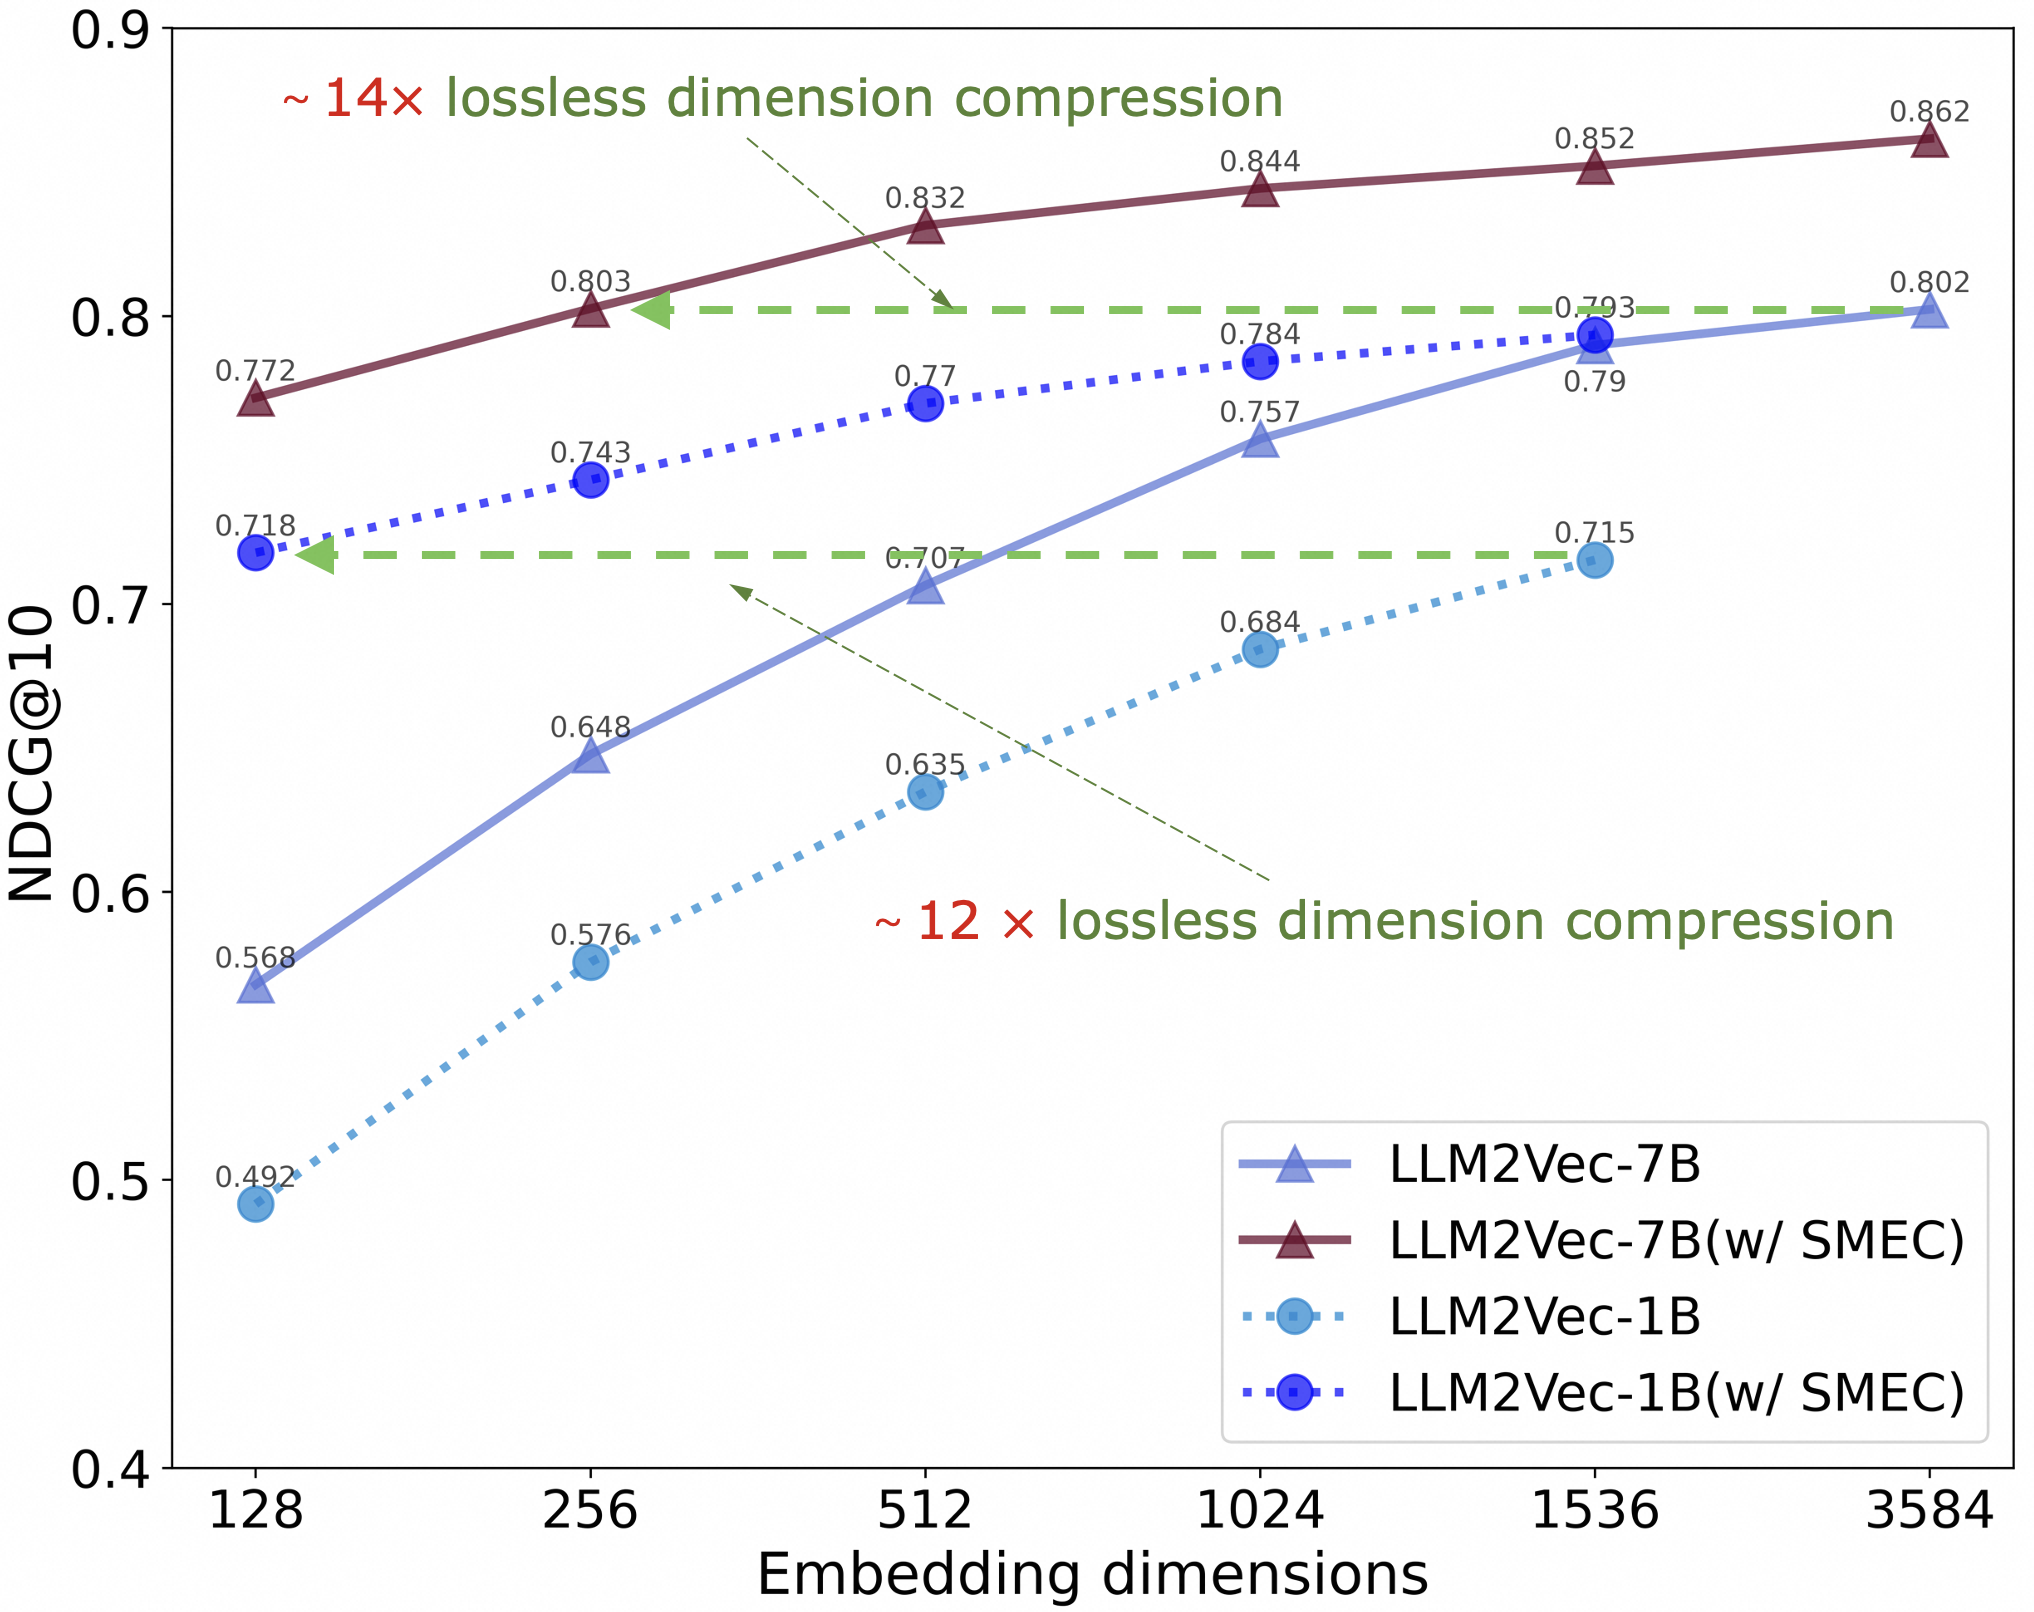
The image is a line chart comparing the performance of different language models (LLM2Vec-7B and LLM2Vec-1B, with and without SMEC) based on their NDCG@10 scores across varying embedding dimensions. The x-axis represents embedding dimensions, while the y-axis represents the NDCG@10 score. The chart also indicates lossless dimension compression ratios for two of the models.
### Components/Axes
* **Title:** None explicitly present in the image.
* **X-axis:**
* **Label:** Embedding dimensions
* **Scale:** 128, 256, 512, 1024, 1536, 3584
* **Y-axis:**
* **Label:** NDCG@10
* **Scale:** 0.4, 0.5, 0.6, 0.7, 0.8, 0.9
* **Legend:** Located in the bottom-right corner of the chart.
* **LLM2Vec-7B:** Solid blue line with triangle markers.
* **LLM2Vec-7B (w/ SMEC):** Solid maroon line with triangle markers.
* **LLM2Vec-1B:** Dotted light blue line with circle markers.
* **LLM2Vec-1B (w/ SMEC):** Dotted dark blue line with circle markers.
### Detailed Analysis
* **LLM2Vec-7B (Solid Blue Line, Triangle Markers):**
* Trend: Slopes upward.
* Data Points:
* 128: 0.568
* 256: 0.648
* 512: 0.707
* 1024: 0.757
* 1536: 0.790
* 3584: 0.802
* **LLM2Vec-7B (w/ SMEC) (Solid Maroon Line, Triangle Markers):**
* Trend: Slopes upward.
* Data Points:
* 128: 0.772
* 256: 0.803
* 512: 0.832
* 1024: 0.844
* 1536: 0.852
* 3584: 0.862
* **LLM2Vec-1B (Dotted Light Blue Line, Circle Markers):**
* Trend: Slopes upward.
* Data Points:
* 128: 0.492
* 256: 0.576
* 512: 0.635
* 1024: 0.684
* 1536: 0.715
* 3584: Not explicitly labeled, but appears to be around 0.73.
* **LLM2Vec-1B (w/ SMEC) (Dotted Dark Blue Line, Circle Markers):**
* Trend: Slopes upward.
* Data Points:
* 128: 0.718
* 256: 0.743
* 512: 0.770
* 1024: 0.784
* 1536: 0.793
* 3584: 0.802
* **Annotations:**
* "~ 14x lossless dimension compression": Points to the LLM2Vec-7B (w/ SMEC) line.
* "~ 12 x lossless dimension compression": Points to the LLM2Vec-1B line.
### Key Observations
* The LLM2Vec-7B models (both with and without SMEC) consistently outperform the LLM2Vec-1B models across all embedding dimensions.
* For both the 7B and 1B models, using SMEC generally improves performance.
* The performance gains from increasing embedding dimensions appear to diminish as the dimensions increase, especially for the LLM2Vec-7B (w/ SMEC) model.
* The LLM2Vec-7B (w/ SMEC) model achieves the highest NDCG@10 scores.
### Interpretation
The chart demonstrates the impact of model size (7B vs. 1B), the use of SMEC, and embedding dimensions on the performance of language models, as measured by NDCG@10. The LLM2Vec-7B model with SMEC shows the best performance, suggesting that both a larger model size and the SMEC technique contribute to improved ranking quality. The annotations regarding lossless dimension compression suggest that these models can achieve good performance even with reduced dimensionality, potentially saving computational resources. The diminishing returns observed with increasing embedding dimensions indicate that there may be an optimal point beyond which further increases in dimensionality provide minimal performance gains.