## Charts: Performance Impact of Architectural Choices
### Overview
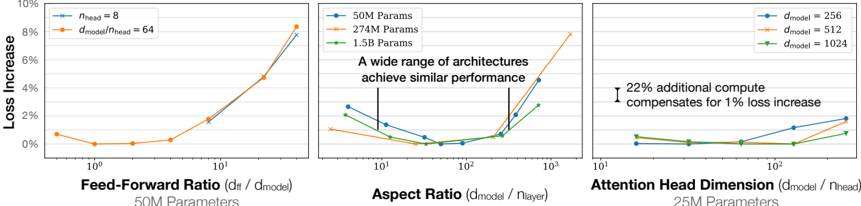
The image presents three separate charts comparing the impact of different architectural choices on model loss increase. Each chart focuses on a different parameter: Feed-Forward Ratio, Aspect Ratio, and Attention Head Dimension. Each chart also displays results for different model sizes (parameter counts).
### Components/Axes
Each chart shares the following components:
* **Y-axis:** "Loss Increase" (percentage), ranging from 0% to 10%.
* **X-axis:** Varies depending on the chart, representing the architectural parameter being tested. The X-axis is on a logarithmic scale.
* **Legends:** Each chart has a legend indicating the different model sizes (parameter counts) and/or model dimensions used in the experiment.
**Chart 1: Feed-Forward Ratio (df / dmodel)**
* X-axis label: "Feed-Forward Ratio (df / dmodel)"
* Legend:
* Orange: 50M Params
* Blue: 27M Params
* Yellow: 1.5B Params
**Chart 2: Aspect Ratio (dmodel / nlayer)**
* X-axis label: "Aspect Ratio (dmodel / nlayer)"
* Legend:
* Orange: 50M Params
* Blue: 27M Params
* Yellow: 1.5B Params
* Text Overlay: "A wide range of architectures achieve similar performance"
**Chart 3: Attention Head Dimension (dmodel / nhead)**
* X-axis label: "Attention Head Dimension (dmodel / nhead)"
* Legend:
* Blue: dmodel = 256
* Green: dmodel = 512
* Purple: dmodel = 1024
* Annotation: "22% additional compute compensates for 1% loss increase"
### Detailed Analysis or Content Details
**Chart 1: Feed-Forward Ratio**
* **50M Params (Orange):** Starts at approximately 1.5% loss increase at a ratio of 10^0 (1). Decreases to approximately 0.5% at a ratio of 10^1 (10). Then sharply increases to approximately 9% at a ratio of 10^2 (100).
* **27M Params (Blue):** Starts at approximately 1.5% loss increase at a ratio of 10^0 (1). Decreases to approximately 0.2% at a ratio of 10^1 (10). Then sharply increases to approximately 8% at a ratio of 10^2 (100).
* **1.5B Params (Yellow):** Remains relatively flat around 0.5% loss increase across the entire range of feed-forward ratios.
**Chart 2: Aspect Ratio**
* **50M Params (Orange):** Starts at approximately 3% loss increase at a ratio of 10^0 (1). Decreases to approximately 1% at a ratio of 10^1 (10). Then sharply increases to approximately 8% at a ratio of 10^2 (100).
* **27M Params (Blue):** Starts at approximately 2% loss increase at a ratio of 10^0 (1). Decreases to approximately 0.5% at a ratio of 10^1 (10). Then increases to approximately 4% at a ratio of 10^2 (100).
* **1.5B Params (Yellow):** Remains relatively flat around 0.5% loss increase across the entire range of aspect ratios.
**Chart 3: Attention Head Dimension**
* **dmodel = 256 (Blue):** Starts at approximately 1.5% loss increase at a ratio of 10^0 (1). Remains relatively flat around 1.5% to 2% loss increase across the entire range.
* **dmodel = 512 (Green):** Starts at approximately 0.5% loss increase at a ratio of 10^0 (1). Decreases to approximately 0.2% at a ratio of 10^1 (10). Then increases to approximately 1.5% at a ratio of 10^2 (100).
* **dmodel = 1024 (Purple):** Starts at approximately 0.5% loss increase at a ratio of 10^0 (1). Remains relatively flat around 0.5% to 1% loss increase across the entire range.
### Key Observations
* **Feed-Forward Ratio & Aspect Ratio:** Larger models (1.5B Params) are less sensitive to changes in Feed-Forward Ratio and Aspect Ratio, maintaining a low and stable loss increase. Smaller models (50M and 27M Params) exhibit a significant loss increase at higher ratios.
* **Attention Head Dimension:** The loss increase is relatively stable across different attention head dimensions, with slight variations.
* **Scale Sensitivity:** The charts consistently demonstrate that smaller models are more sensitive to architectural choices than larger models.
* **Logarithmic Scale:** The X-axis is logarithmic, meaning that equal distances represent multiplicative changes in the parameter values.
### Interpretation
These charts demonstrate the impact of different architectural choices on model performance, specifically measured by loss increase. The key takeaway is that larger models (1.5B parameters) are more robust to variations in Feed-Forward Ratio and Aspect Ratio. This suggests that larger models have a greater capacity to learn and adapt to different configurations.
The annotation on the Attention Head Dimension chart indicates a trade-off between computational cost and performance. A 22% increase in compute can compensate for a 1% loss increase, suggesting that increasing computational resources can improve model accuracy.
The text overlay on the Aspect Ratio chart ("A wide range of architectures achieve similar performance") reinforces the idea that there is not a single optimal architecture, and that a variety of configurations can achieve comparable results. This is particularly true for larger models.
The consistent trend across the charts highlights the importance of model size in determining robustness to architectural choices. Smaller models require more careful tuning of hyperparameters to achieve optimal performance, while larger models are more forgiving. The logarithmic scale on the x-axis suggests that the impact of these parameters is not linear, and that there may be diminishing returns to increasing their values beyond a certain point.