## Diagram Set: Neuromorphic Computing Components & Characteristics
### Overview
This image presents a set of diagrams and data visualizations related to neuromorphic computing, specifically focusing on memristive devices and their application in building logic gates and neural networks. The image is divided into six sections (a-f), each illustrating a different aspect of the system.
### Components/Axes
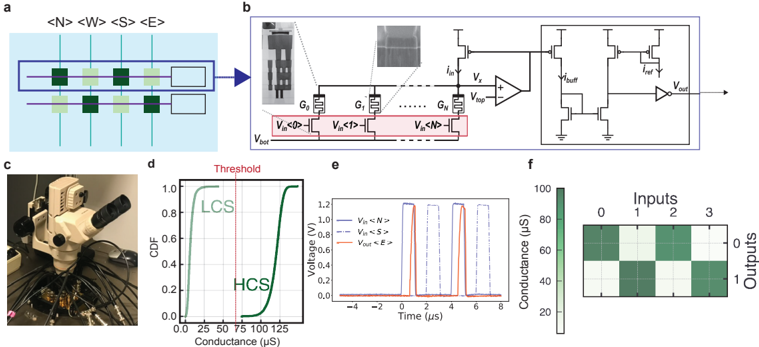
* **a:** Schematic representation of a memristive crossbar array with labeled inputs: <N>, <W>, <S>, <E>.
* **b:** Circuit diagram showing the implementation of a logic gate using memristors and an operational amplifier. Includes transistor schematics and voltage labels (V<sub>bot</sub>, V<sub>in</sub>, V<sub>buff</sub>, V<sub>out</sub>).
* **c:** Photograph of a physical experimental setup, likely a probe station with a memristive device under test.
* **d:** Cumulative Distribution Function (CDF) plot of conductance (µS) with labeled curves: LCS (Low Conductance State) and HCS (High Conductance State). X-axis: Conductance (µS) from 0 to 125. Y-axis: CDF from 0 to 1.0. A vertical line indicates a "Threshold" value at approximately 25 µS.
* **e:** Time-series plot of voltage (V<sub>in</sub>) vs. time (µs) for different input signals: V<sub>in</sub> <N>, V<sub>in</sub> <W>, V<sub>in</sub> <S>, V<sub>in</sub> <E>. X-axis: Time (µs) from -4 to 8. Y-axis: Voltage (V) from 0 to 1.2.
* **f:** Heatmap showing conductance (µS) as a function of inputs (0, 1, 2, 3) and outputs. X-axis: Inputs (0, 1, 2, 3). Y-axis: Conductance (µS) from 20 to 80.
### Detailed Analysis or Content Details
**a:** The schematic shows a grid of square elements, presumably memristors, arranged in a crossbar configuration. The inputs <N>, <W>, <S>, and <E> likely represent North, West, South, and East, indicating the direction of addressing or signal input.
**b:** The circuit diagram illustrates a differential amplifier configuration. The memristors (labeled G<sub>i</sub>) are connected in series between the input and output. The transistors are arranged in a cascaded inverter configuration. The diagram shows how the memristor's conductance modulates the output voltage.
**c:** The photograph shows a complex experimental setup with various cables and components. It appears to be a probe station used for making electrical contact with a small device.
**d:** The CDF plot shows the distribution of conductance values for the memristive devices. The LCS curve rises steeply from 0 to approximately 0.4 at around 10 µS, indicating a high probability of low conductance states. The HCS curve rises more gradually, reaching 0.4 at around 50 µS, indicating a broader distribution of high conductance states. The threshold is set at approximately 25 µS.
**e:** The time-series plot shows voltage pulses for each input signal. The pulses are approximately 2 µs wide and have a peak voltage of around 1.2 V. The pulses are offset in time, suggesting sequential application of inputs.
**f:** The heatmap shows the relationship between inputs and conductance. The color intensity represents the conductance value. The heatmap appears to demonstrate a non-linear relationship between inputs and outputs, with varying conductance values for different input combinations. The conductance values range from approximately 20 µS to 80 µS. The pattern suggests a complex mapping between inputs and outputs, potentially representing a logic function or a neural network weight matrix.
### Key Observations
* The CDF plot (d) shows a clear bimodal distribution of conductance, indicating distinct low and high conductance states.
* The time-series plot (e) demonstrates the ability to apply different input signals sequentially.
* The heatmap (f) suggests a complex, non-linear relationship between inputs and outputs, indicative of computational functionality.
* The circuit diagram (b) shows a potential implementation of a logic gate using memristors.
### Interpretation
The image demonstrates the potential of memristive devices for building neuromorphic computing systems. The crossbar array (a) provides a dense connectivity matrix, while the circuit diagram (b) shows how memristors can be used to implement logic gates. The CDF plot (d) confirms the bistable nature of the memristors, allowing them to store information in the form of conductance states. The time-series plot (e) shows the ability to control the input signals, and the heatmap (f) suggests that the system can perform complex computations.
The threshold value in the CDF plot (d) is crucial for defining the switching behavior of the memristors. The non-linear relationship between inputs and outputs in the heatmap (f) is a key characteristic of neural networks and other complex computational systems. The experimental setup in (c) suggests that these concepts are being actively investigated in a laboratory setting.
The overall data suggests a functional neuromorphic system capable of performing computations based on the manipulation of memristive conductance states. The system's ability to represent and process information in a manner analogous to the human brain could lead to significant advances in artificial intelligence and machine learning.