\n
## Diagram: Gaussian Pyramid Level Representation
### Overview
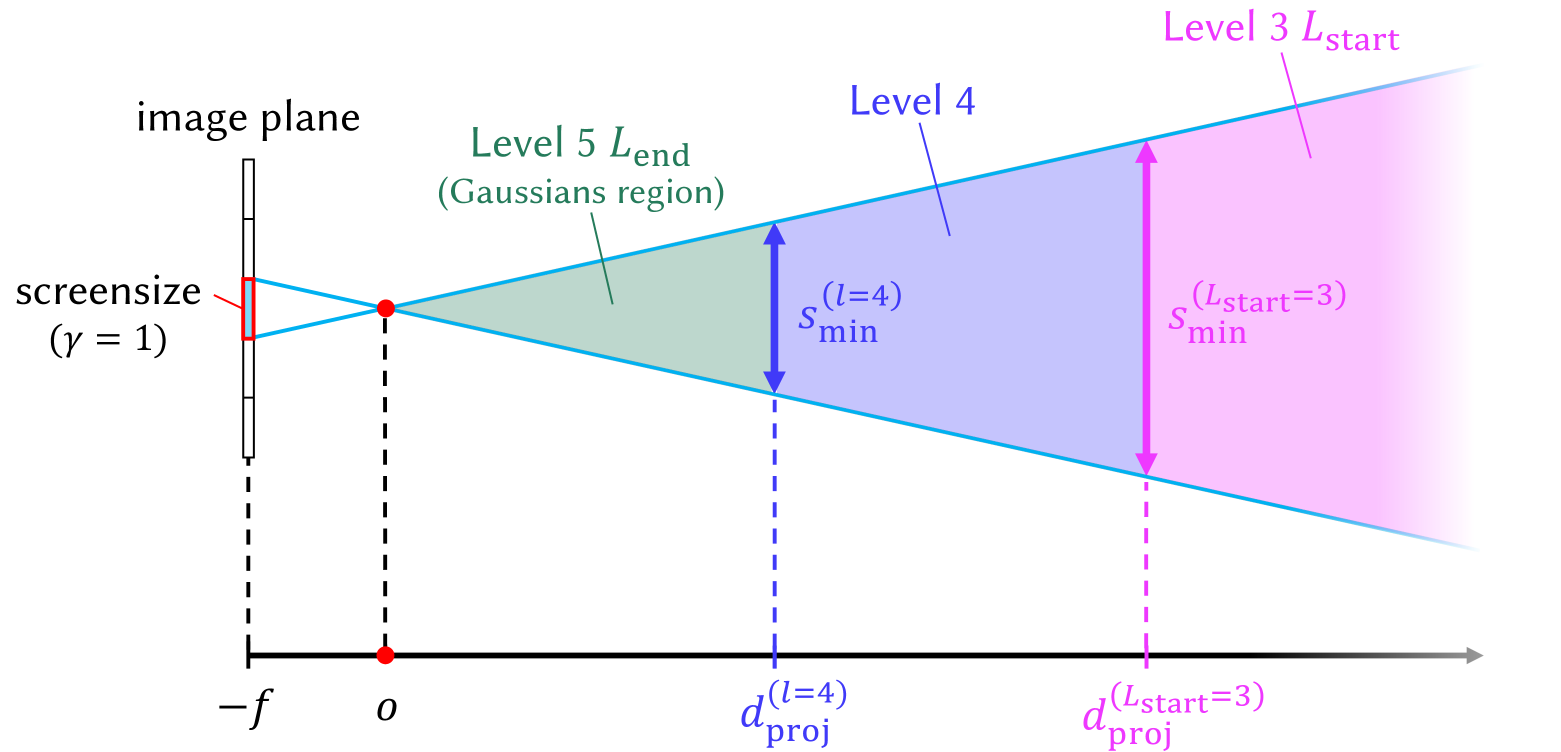
This diagram illustrates the levels of a Gaussian pyramid, likely used in image processing or computer vision. It depicts the projection of the image plane through different levels of the pyramid, showing how the image size and projection distance change at each level. The diagram uses a ray-tracing-like representation to visualize the process.
### Components/Axes
* **Horizontal Axis:** Represents the distance along the optical axis. Marked with `-f`, `0`, `dproj(L=4)`, and `dproj(Lstart=3)`. The scale is not explicitly defined, but it appears linear.
* **Vertical Axis:** Represents the image plane or screen size. Labeled as "screensize (γ = 1)".
* **Image Plane:** A vertical line on the left, labeled "image plane".
* **Levels:** Five levels are depicted, labeled "Level 3 Lstart", "Level 4", "Level 5 Lend (Gaussians region)".
* **Projection Lines:** Colored lines representing the projection of the image through each level.
* **Markers:** Red dots mark key points on the optical axis.
* **Labels:** `Smin(L=4)`, `Smin(Lstart=3)` indicate the minimum size at each level.
### Detailed Analysis
The diagram shows a series of projections from the image plane to different levels of the Gaussian pyramid.
* **Level 3 Lstart (Magenta):** Starts at a point beyond the image plane (negative distance) and projects to `dproj(Lstart=3)` on the horizontal axis. `Smin(Lstart=3)` is indicated at this level. The line slopes downward.
* **Level 4 (Light Blue):** Starts at the image plane (0) and projects to `dproj(L=4)` on the horizontal axis. `Smin(L=4)` is indicated at this level. The line slopes downward.
* **Level 5 Lend (Light Green):** Starts at the image plane (0) and projects to `dproj(L=4)` on the horizontal axis. This level is labeled as the "Gaussians region". The line slopes downward.
* **f:** The image plane is located at -f.
* The distance `dproj(L=4)` and `dproj(Lstart=3)` are indicated on the horizontal axis.
The diagram does not provide specific numerical values for the distances or sizes, only relative positions and labels.
### Key Observations
* The projection distance increases as the level number increases.
* The lines representing the projections converge towards the right side of the diagram.
* The "Gaussians region" (Level 5) is positioned between Level 4 and the image plane.
* The `Smin` values appear to be related to the level number.
### Interpretation
This diagram illustrates the concept of a Gaussian pyramid, a multi-scale representation of an image. Each level of the pyramid represents a downsampled version of the original image, with increasing levels corresponding to smaller image sizes and larger projection distances. The "Gaussians region" (Level 5) likely refers to the application of Gaussian blurring at that level, which is a common step in creating a Gaussian pyramid.
The diagram suggests that the projection process is used to map features from the image plane to different scales within the pyramid. The `Smin` values likely represent the minimum size of features that can be reliably detected at each level. The diagram is a conceptual illustration and does not provide quantitative data, but it effectively conveys the relationships between the different levels of the Gaussian pyramid and the projection process. The use of different colors for each level helps to visually distinguish the projections and understand the flow of information.