\n
## Scatter Plot: Confidence vs. Target Length (College Mathematics)
### Overview
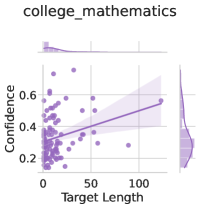
The image presents a scatter plot visualizing the relationship between "Target Length" and "Confidence" for a dataset labeled "college_mathematics". A regression line with a confidence interval is overlaid on the scatter points. Marginal distributions (histograms) are displayed above and to the right of the main plot.
### Components/Axes
* **Title:** "college\_mathematics" (top-center)
* **X-axis:** "Target Length" (bottom-center), ranging from approximately 0 to 110.
* **Y-axis:** "Confidence" (left-center), ranging from approximately 0.2 to 0.65.
* **Scatter Points:** Numerous purple dots representing individual data points.
* **Regression Line:** A purple line representing the trend of the data.
* **Confidence Interval:** A light purple shaded area around the regression line, indicating the uncertainty in the estimated trend.
* **Marginal Distribution (Top):** A histogram showing the distribution of "Target Length".
* **Marginal Distribution (Right):** A histogram showing the distribution of "Confidence".
### Detailed Analysis
The scatter plot shows a generally positive, but weak, correlation between "Target Length" and "Confidence".
* **Regression Line Trend:** The regression line slopes upward, indicating that as "Target Length" increases, "Confidence" tends to increase. However, the slope is relatively shallow.
* **Scatter Point Distribution:** The points are clustered around the x-axis (Target Length = 0) with a high density of points between 0.2 and 0.4 on the Confidence axis. As Target Length increases, the density of points decreases.
* **Data Points (Approximate Values):**
* At Target Length = 0, Confidence ranges from approximately 0.2 to 0.5.
* At Target Length = 50, Confidence ranges from approximately 0.25 to 0.55.
* At Target Length = 100, Confidence is approximately 0.6.
* **Marginal Distribution (Target Length):** The distribution of "Target Length" is skewed to the right, with a peak around 0 and a long tail extending to higher values.
* **Marginal Distribution (Confidence):** The distribution of "Confidence" is also skewed to the right, with a peak around 0.3 and a tail extending to higher values.
### Key Observations
* The relationship between "Target Length" and "Confidence" is not strong. The scatter points are widely dispersed around the regression line.
* There is a higher concentration of data points with low "Target Length" values.
* The marginal distributions suggest that both "Target Length" and "Confidence" are not normally distributed.
### Interpretation
The data suggests that there is a slight positive association between the length of the target and the confidence level in the context of college mathematics. However, the relationship is weak, and other factors likely play a significant role in determining confidence. The skewed distributions of both variables indicate that the data may not be representative of the entire population or that there are underlying factors influencing the observed patterns. The concentration of data points with low target lengths could indicate that most tasks or questions in this dataset are relatively short. The marginal distributions provide additional context, showing the range and frequency of each variable independently. The confidence interval around the regression line highlights the uncertainty in the estimated relationship, suggesting that the observed trend may not be consistent across all samples.