# Technical Document Extraction: Scatter Plot Analysis
## 1. Document Overview
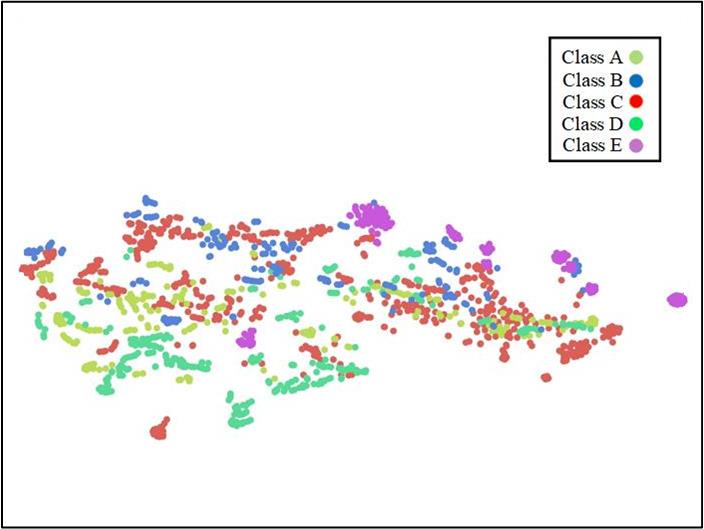
This image is a 2D scatter plot, likely a t-SNE or UMAP visualization, used to represent high-dimensional data in a two-dimensional space. The plot displays a distribution of data points categorized into five distinct classes.
## 2. Component Isolation
### A. Header / Legend Region
* **Location:** Top-right corner [approx. x=780, y=70 to x=950, y=320 in a normalized 1000x1000 scale].
* **Content:** A boxed legend containing five categories with corresponding color-coded circular markers.
* **Legend Labels & Color Mapping:**
* **Class A:** Light Green / Lime (Hex approx: #BADA55 / #C0E080)
* **Class B:** Blue (Hex approx: #2070C0)
* **Class C:** Red (Hex approx: #E04040)
* **Class D:** Bright Green / Mint (Hex approx: #30E080)
* **Class E:** Purple / Magenta (Hex approx: #C070C0)
### B. Main Chart Region
* **Location:** Center and lower half of the image.
* **Axis Information:** There are no visible axis titles, numerical scales, or grid lines. This indicates the plot focuses on the relative spatial clustering and separation of classes rather than absolute coordinate values.
---
## 3. Data Distribution and Trend Analysis
The data points are organized in a horizontal, elongated cloud with several distinct clusters and significant overlapping regions.
### Class-Specific Trends:
* **Class A (Light Green):**
* **Trend:** Distributed primarily in the central and lower-left regions of the main cloud.
* **Clustering:** Forms several small, loose horizontal bands. It is heavily interleaved with Class D and Class C.
* **Class B (Blue):**
* **Trend:** Concentrated in the upper-central portion of the data cloud.
* **Clustering:** Appears in small, dense "islands" or short horizontal streaks. It maintains some separation from the bottom-most points but overlaps with Class C in the upper-mid section.
* **Class C (Red):**
* **Trend:** This is the most widely distributed class, spanning the entire horizontal width of the plot.
* **Clustering:** It forms the "backbone" of the visualization. There is a notable outlier cluster at the very bottom-left and a dense concentration on the far-right edge of the main mass.
* **Class D (Bright Green):**
* **Trend:** Primarily located in the lower-left and lower-central areas.
* **Clustering:** Shows a tendency to form curved or "worm-like" structures. It is closely associated spatially with Class A.
* **Class E (Purple):**
* **Trend:** Highly localized compared to other classes.
* **Clustering:** Forms distinct, isolated clusters. Notable clusters are located at the top-center, top-right, and a small isolated group in the lower-left center. There is also a single, very isolated point/small group on the extreme far-right of the image.
---
## 4. Spatial Grounding & Observations
| Feature | Description |
| :--- | :--- |
| **Overall Shape** | An irregular, horizontally oriented cluster. |
| **Class Separation** | Low global separation. Classes A, C, and D show high degrees of overlap, suggesting similar features. Class E shows the highest degree of distinct clustering (local separation). |
| **Outliers** | A small Red (Class C) cluster is isolated at the bottom left. A Purple (Class E) cluster is isolated on the far right. |
| **Density** | The highest density of points occurs in the central horizontal band where Classes A, B, and C converge. |
## 5. Textual Transcription
The only text present in the image is within the legend box:
* `Class A`
* `Class B`
* `Class C`
* `Class D`
* `Class E`
**Language Declaration:** The text is entirely in **English**. No other languages are present.