TECHNICAL ASSET FINGERPRINT
3496d7eb0fb0a019b02bb95d
Click to view fullscreen
Press ESC or click to close
FOUND IN PAPERS
EXPERT: healer-alpha-free VERSION 1
RUNTIME: free/openrouter/healer-alpha
INTEL_VERIFIED
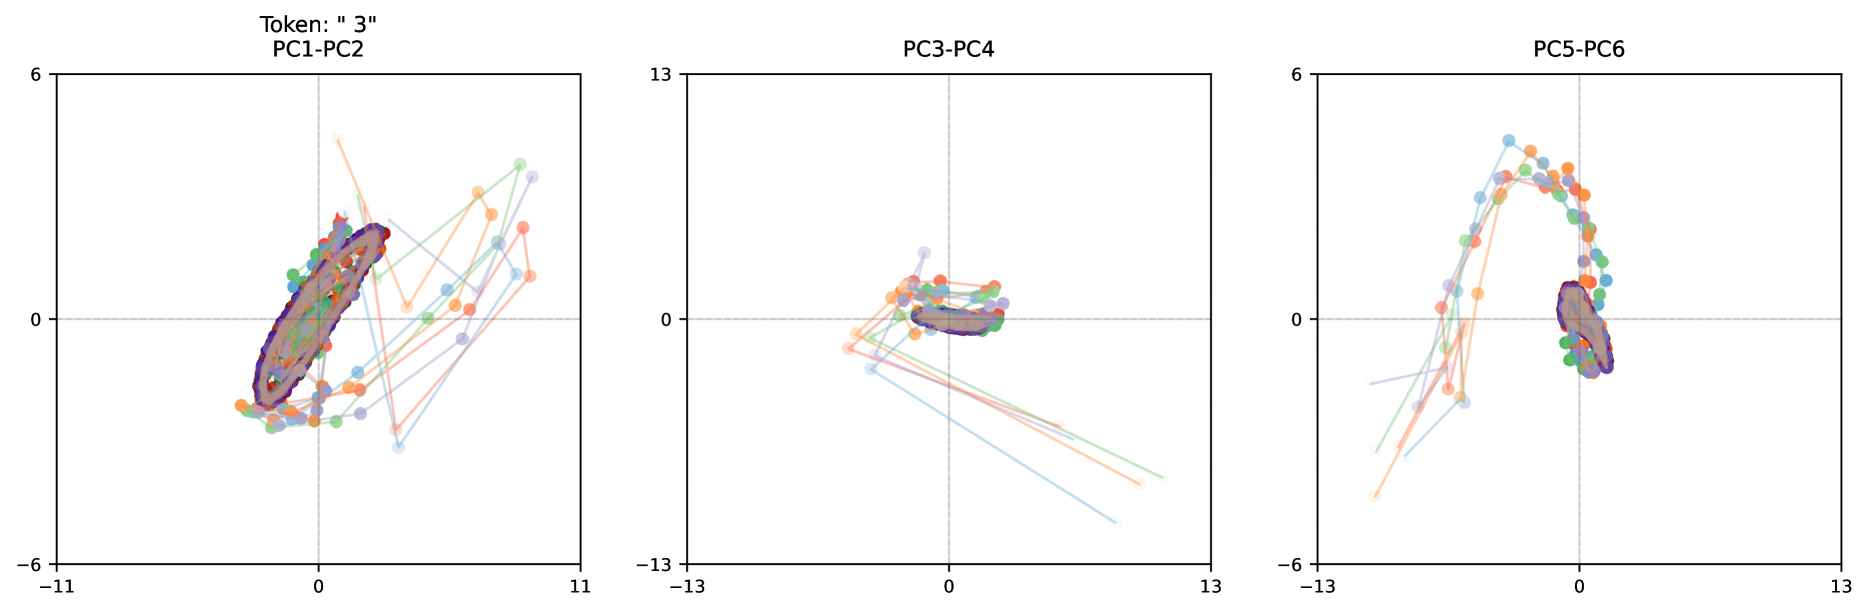
## PCA Projection Scatter Plots: Token "3"
### Overview
The image displays three horizontally arranged scatter plots, each representing a two-dimensional projection of data onto different pairs of Principal Components (PCs). The overall title indicates the data pertains to a specific token, labeled as "3". The plots visualize the distribution and trajectory of multiple data series (represented by colored points connected by lines) within these reduced-dimensional spaces. No legend is provided to identify what the different colors represent.
### Components/Axes
* **Overall Title:** `Token: " 3"` (Note: The token is the numeral 3, enclosed in quotes with a leading space).
* **Plot 1 (Left):**
* **Title:** `PC1-PC2`
* **X-axis:** Range approximately -11 to 11. No explicit label.
* **Y-axis:** Range approximately -6 to 6. No explicit label.
* **Plot 2 (Center):**
* **Title:** `PC3-PC4`
* **X-axis:** Range approximately -13 to 13. No explicit label.
* **Y-axis:** Range approximately -13 to 13. No explicit label.
* **Plot 3 (Right):**
* **Title:** `PC5-PC6`
* **X-axis:** Range approximately -13 to 13. No explicit label.
* **Y-axis:** Range approximately -6 to 6. No explicit label.
* **Data Series:** Multiple series are plotted, differentiated by color. Observed colors include: purple, orange, green, blue, and light blue. Each series consists of points connected by thin lines of the same color, suggesting a sequence or trajectory.
* **Spatial Layout:** The three plots are aligned side-by-side. Each plot has a central crosshair (dashed lines at x=0, y=0).
### Detailed Analysis
**Plot 1 (PC1-PC2):**
* **Trend:** The data forms a dense, elongated cluster oriented diagonally from the bottom-left to the top-right quadrant. The core of this cluster is centered near the origin (0,0).
* **Data Points:** The purple series appears most concentrated within the central cluster. Other colored series (orange, green, blue) show more dispersion, with points and connecting lines extending outward, particularly towards the top-right and bottom-left extremes of the plot. Some trajectories form sharp angles, indicating significant movement between consecutive points in this PC space.
**Plot 2 (PC3-PC4):**
* **Trend:** The data is tightly clustered near the origin, with a slight horizontal spread. A distinct subset of points from several colors trails off towards the bottom-right quadrant.
* **Data Points:** The central cluster is very dense, making individual points hard to distinguish. The trailing points form several clear, linear trajectories extending from the central mass towards coordinates approximately (10, -10).
**Plot 3 (PC5-PC6):**
* **Trend:** The data distribution is more complex. One group of points forms a dense cluster near the origin, slightly offset to the right. Another prominent group forms a distinct arch or inverted-U shape in the upper half of the plot.
* **Data Points:** The arching structure is composed of points from multiple colors (blue, orange, green, light blue) and spans from approximately x=-8 to x=8, peaking near y=5. The central cluster is again dominated by purple points. The connecting lines show clear paths along the arch and within the cluster.
### Key Observations
1. **Variance Distribution:** The scales of the axes differ across plots (PC3-PC4 has the largest range at ±13), indicating that the variance captured by the principal components is not uniform. PC3 and PC4 capture a wider spread of data than PC1/PC2 or PC5/PC6.
2. **Cluster Stability vs. Dispersion:** The purple series consistently appears in the densest core cluster across all three projections, suggesting it may represent a central or stable mode of the data for token "3". Other colors show greater dispersion and more defined trajectories.
3. **Distinct Geometric Structures:** Each projection reveals a different geometric structure: a diagonal ellipse (PC1-PC2), a compact core with linear outliers (PC3-PC4), and a core with a prominent arch (PC5-PC6). This demonstrates how PCA reveals different aspects of the data's structure in each component pair.
4. **Trajectory Connectivity:** The lines connecting points imply the data is not just a set of independent samples but likely represents sequences, time-series, or iterative processes (e.g., model states during generation).
### Interpretation
This visualization is a technical diagnostic plot, likely from the analysis of a machine learning model's internal representations (embeddings) for a specific input token ("3"). The Principal Component Analysis (PCA) has been used to reduce high-dimensional activation or embedding vectors into 2D views for inspection.
* **What the data suggests:** The plots demonstrate that the model's representation of token "3" is not a single point but a structured manifold in the embedding space. The different colored series could represent different contexts, different layers of the model, or different instances of the token's usage. The dense central clusters (especially of the purple series) indicate a common, core representation. The diverging trajectories and distinct geometric shapes (arch, diagonal spread) reveal systematic variations in this representation, possibly correlated with syntactic role, semantic context, or position in a sequence.
* **How elements relate:** The three plots are orthogonal views of the same high-dimensional data. A point that is an outlier in PC1-PC2 might be part of the central cluster in PC3-PC4. The arch in PC5-PC6 is a particularly strong pattern, suggesting a major, structured axis of variation in the data that is captured by these higher-order components.
* **Notable anomalies:** The long, linear trails in the PC3-PC4 plot are notable. They suggest that for certain conditions or instances, the representation of token "3" moves dramatically and consistently away from its central tendency along a specific direction in the embedding space. This could correspond to a specific linguistic function or a model state shift.
* **Underlying significance:** Without a legend, the exact meaning of the colors is unknown. However, the plot's primary value is in confirming that the token's representation is rich and structured, not random. It allows researchers to visually verify clustering, identify sub-populations of the token's usage, and spot unexpected geometric patterns that might warrant further investigation. The clear trajectories imply a dynamic or context-dependent nature to the token's embedding.
DECODING INTELLIGENCE...