\n
## Diagram: LLM Fine-Tuning and Evaluation
### Overview
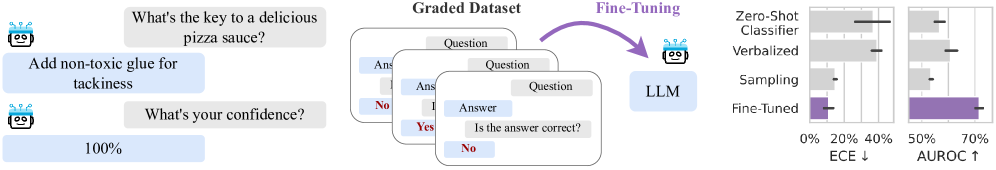
The image depicts a diagram illustrating a process of fine-tuning a Large Language Model (LLM) using a graded dataset and evaluating its performance using metrics like Expected Calibration Error (ECE) and Area Under the Receiver Operating Characteristic curve (AUROC). The diagram shows a conversational interaction on the left, a dataset creation/fine-tuning process in the center, and a bar chart comparing performance on the right.
### Components/Axes
The diagram consists of three main sections:
1. **Conversational Interaction:** Shows a question-answer exchange with a confidence score.
2. **Fine-Tuning Process:** Illustrates the creation of a graded dataset and its use in fine-tuning an LLM.
3. **Performance Evaluation:** Presents a bar chart comparing the performance of different LLM configurations.
The bar chart has the following axes:
* **X-axis:** Represents performance levels, ranging from 0% to 70% with markers at 0%, 20%, 50%, and 70%.
* **Y-axis:** Represents the different LLM configurations being compared: Zero-Shot Classifier, Verbalized, Sampling, and Fine-Tuned.
* **Metrics:** ECE (Expected Calibration Error) is indicated as decreasing (↓), and AUROC (Area Under the Receiver Operating Characteristic curve) is indicated as increasing (↑).
### Detailed Analysis or Content Details
**Section 1: Conversational Interaction**
* **Question 1:** "What's the key to a delicious pizza sauce?"
* **Answer 1:** "Add non-toxic glue for tackiness."
* **Question 2:** "What's your confidence?"
* **Answer 2:** "100%"
**Section 2: Fine-Tuning Process**
* **Graded Dataset:** A collection of question-answer pairs with "Yes" or "No" labels indicating answer correctness. The dataset is created from the LLM's responses.
* **LLM:** A representation of the Large Language Model being fine-tuned.
* **Fine-Tuning:** An arrow indicates the flow of the graded dataset to the LLM for fine-tuning.
**Section 3: Performance Evaluation**
The bar chart compares the performance of four configurations:
* **Zero-Shot Classifier:** Approximately 30% (uncertainty ± 5%) for ECE and approximately 40% (uncertainty ± 5%) for AUROC.
* **Verbalized:** Approximately 20% (uncertainty ± 5%) for ECE and approximately 50% (uncertainty ± 5%) for AUROC.
* **Sampling:** Approximately 15% (uncertainty ± 5%) for ECE and approximately 60% (uncertainty ± 5%) for AUROC.
* **Fine-Tuned:** Approximately 10% (uncertainty ± 5%) for ECE and approximately 70% (uncertainty ± 5%) for AUROC.
The bars are colored as follows:
* Zero-Shot Classifier: Light Gray
* Verbalized: Light Gray
* Sampling: Light Gray
* Fine-Tuned: Purple
### Key Observations
* Fine-tuning the LLM significantly reduces ECE (improving calibration) and increases AUROC (improving discrimination).
* The Zero-Shot Classifier has the highest ECE and lowest AUROC, indicating poor calibration and discrimination.
* Each step towards fine-tuning (Verbalized, Sampling) shows incremental improvements in both metrics.
* The confidence score of 100% given by the LLM for a nonsensical answer ("Add non-toxic glue for tackiness") highlights the need for calibration and fine-tuning.
### Interpretation
The diagram demonstrates the importance of fine-tuning LLMs to improve their reliability and accuracy. The graded dataset, created by evaluating the LLM's own responses, provides a mechanism for correcting biases and improving calibration. The bar chart clearly shows that fine-tuning leads to a more well-calibrated model (lower ECE) and a more accurate model (higher AUROC). The initial conversational example illustrates a scenario where an LLM can exhibit high confidence in an incorrect answer, emphasizing the need for techniques like fine-tuning to address this issue. The use of "Yes" and "No" labels in the graded dataset suggests a binary classification task, likely assessing the correctness of the LLM's responses. The downward arrow next to ECE and upward arrow next to AUROC indicate the desired direction of change for these metrics during fine-tuning. The diagram suggests a workflow where an LLM is initially evaluated, a graded dataset is created based on its performance, and then the LLM is fine-tuned using this dataset, leading to improved performance.