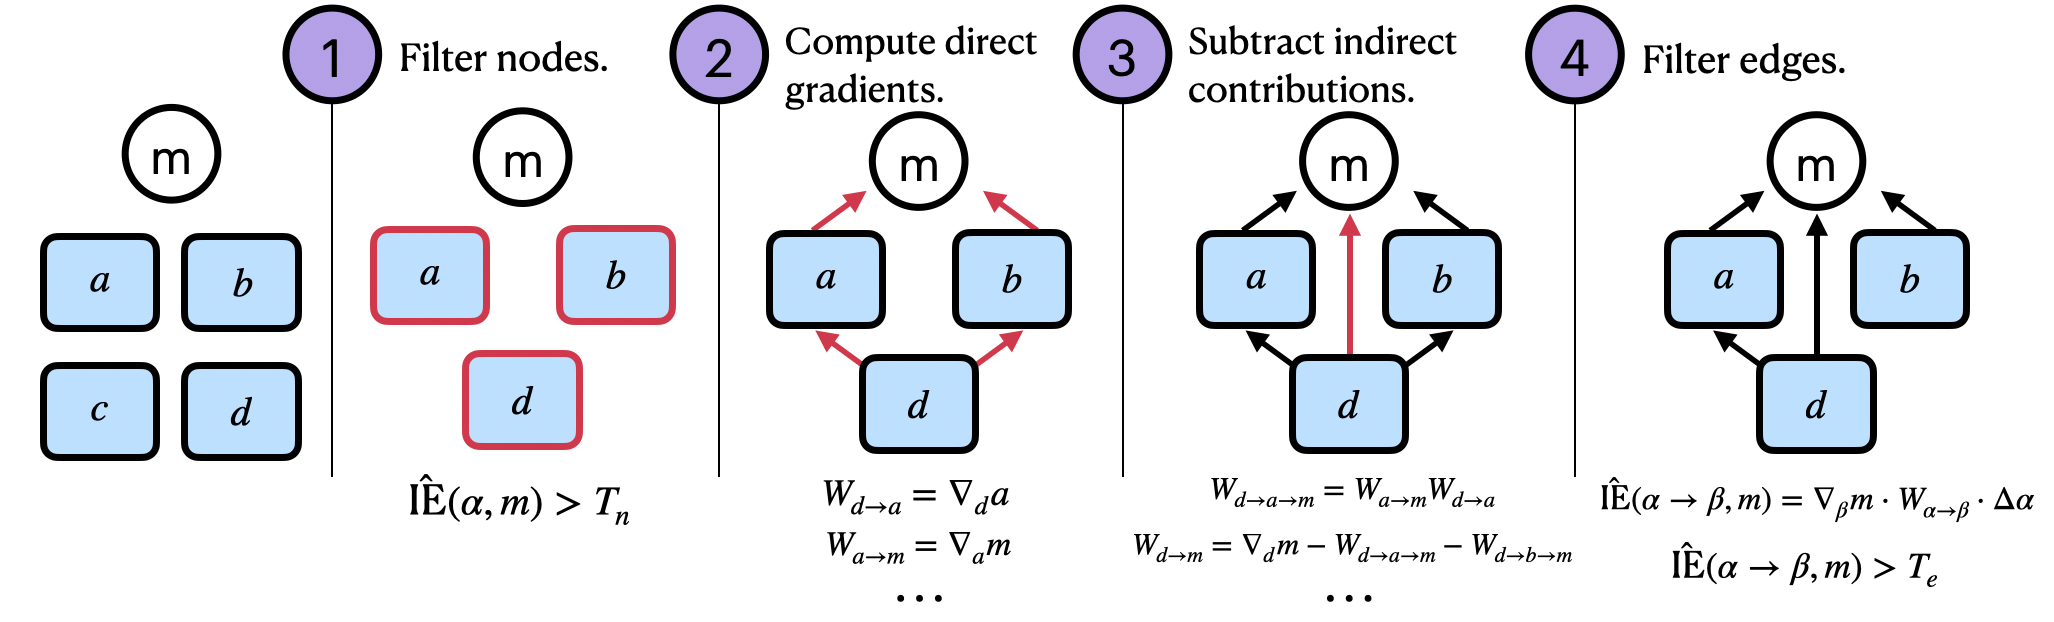
## Flowchart: Node and Edge Filtering Process with Gradient Computation
### Overview
The image depicts a four-step computational process for filtering nodes and edges in a graph structure, incorporating gradient calculations and indirect contribution adjustments. The workflow progresses from node filtering to edge refinement, with mathematical operations defined at each stage.
### Components/Axes
1. **Nodes**: Labeled `a`, `b`, `c`, `d`, and `m` (central node)
2. **Edges**: Directed connections between nodes with gradient/weight annotations
3. **Conditions**:
- Step 1: `ĪE(α, m) > Tₙ` (node filtering threshold)
- Step 4: `ĪE(α → β, m) > Tₑ` (edge filtering threshold)
4. **Mathematical Operations**:
- Gradient computation: `W_d→a = ∇_d a`, `W_a→m = ∇_a m`
- Indirect contribution adjustment: `W_d→a→m = W_a→m W_d→a - W_d→a→m`
### Detailed Analysis
#### Step 1: Filter Nodes
- **Nodes**: `a`, `b`, `c`, `d`, `m`
- **Condition**: Nodes `a`, `b`, `d` are highlighted (red boxes), suggesting they meet `ĪE(α, m) > Tₙ`
- **Excluded Node**: `c` remains unhighlighted, indicating it fails the threshold
#### Step 2: Compute Direct Gradients
- **Gradients**:
- `W_d→a = ∇_d a` (gradient from `d` to `a`)
- `W_a→m = ∇_a m` (gradient from `a` to `m`)
- **Flow**: Arrows show gradient propagation between nodes
#### Step 3: Subtract Indirect Contributions
- **Equations**:
- `W_d→a→m = W_a→m W_d→a - W_d→a→m` (indirect path adjustment)
- `W_d→a→m = ∇_d m - W_d→a→m - W_d→b→m` (combined indirect contributions)
- **Flow**: Black arrows indicate adjusted gradient paths
#### Step 4: Filter Edges
- **Condition**: `ĪE(α → β, m) > Tₑ` (edge-specific threshold)
- **Result**: Only edges between `a` and `b` remain, with `d` excluded from direct connections to `m`
### Key Observations
1. **Node Filtering**: Three nodes (`a`, `b`, `d`) survive the initial threshold, while `c` is excluded.
2. **Gradient Propagation**: Gradients flow bidirectionally between nodes, with adjustments for indirect paths.
3. **Edge Refinement**: Final edge filtering removes connections involving `d`, leaving only `a`–`b` interactions.
### Interpretation
This flowchart represents a graph optimization pipeline, likely for machine learning or network analysis. The process:
1. **Filters nodes** based on a threshold (`Tₙ`), retaining those with significant influence (`m`).
2. **Computes direct gradients** to quantify node interactions.
3. **Adjusts for indirect contributions** (e.g., paths through intermediate nodes), refining gradient accuracy.
4. **Filters edges** using a stricter threshold (`Tₑ`), prioritizing direct, high-impact connections.
The mathematical operations suggest a focus on preserving critical node-edge relationships while eliminating noise or less influential paths. The use of thresholds (`Tₙ`, `Tₑ`) implies a trade-off between computational efficiency and model fidelity. The exclusion of node `c` and edge `d`→`m` highlights sensitivity to the defined criteria, potentially indicating a focus on core graph structure preservation.