# Technical Document Extraction: Cloud System Self-Healing Workflow
This document provides a detailed technical extraction of the provided architectural diagram, which outlines a four-stage pipeline for cloud service monitoring and automated remediation.
## 1. High-Level Overview
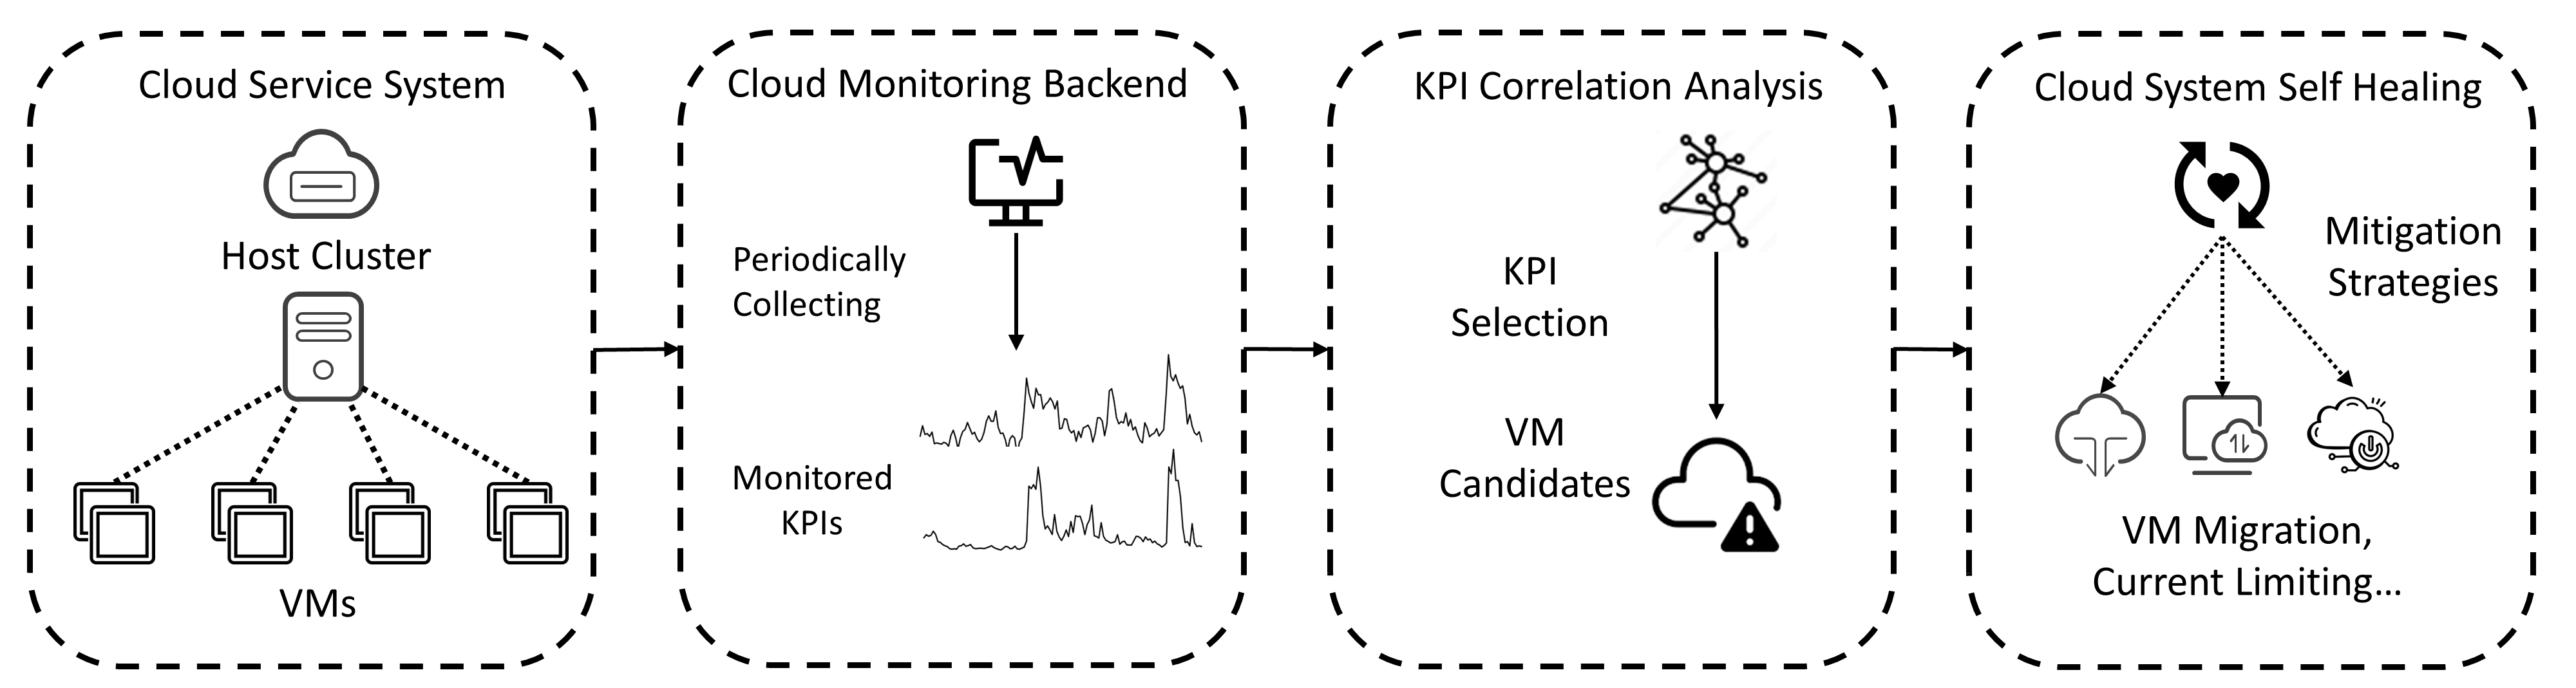
The image depicts a linear, four-stage workflow (from left to right) encapsulated in dashed rounded rectangles. The process flows from infrastructure hosting to data collection, analytical correlation, and finally to automated self-healing actions.
---
## 2. Component Segmentation and Analysis
### Stage 1: Cloud Service System (Infrastructure)
* **Header Label:** Cloud Service System
* **Components:**
* **Host Cluster:** Represented by a cloud icon containing a server rack symbol.
* **Physical Server:** A central server icon connected via dotted lines to multiple Virtual Machines.
* **VMs:** Four individual square icons representing Virtual Machines (VMs) at the base of the hierarchy.
* **Function:** This stage represents the source environment where services are hosted and where raw data originates.
### Stage 2: Cloud Monitoring Backend (Data Collection)
* **Header Label:** Cloud Monitoring Backend
* **Textual Labels:**
* "Periodically Collecting"
* "Monitored KPIs"
* **Visual Components:**
* An icon of a monitor displaying a heartbeat/pulse line.
* A downward-pointing arrow indicating the flow from the monitor to the data.
* **Data Visualization:** Two line charts representing time-series data.
* **Top Chart:** Shows a highly volatile trend with multiple sharp peaks and troughs.
* **Bottom Chart:** Shows a relatively stable baseline with one significant spike toward the end of the timeline.
* **Function:** This stage involves the continuous gathering of Key Performance Indicators (KPIs) from the infrastructure.
### Stage 3: KPI Correlation Analysis (Intelligence)
* **Header Label:** KPI Correlation Analysis
* **Textual Labels:**
* "KPI Selection"
* "VM Candidates"
* **Visual Components:**
* **Network Graph Icon:** A series of nodes and edges representing the correlation between different data points.
* A downward-pointing arrow leading to a cloud icon.
* **Warning Icon:** A cloud icon with a superimposed black triangle containing an exclamation mark (!), signifying the identification of a fault or an anomaly.
* **Function:** This stage processes the collected KPIs to identify specific Virtual Machines that are candidates for remediation based on correlated failure patterns.
### Stage 4: Cloud System Self Healing (Remediation)
* **Header Label:** Cloud System Self Healing
* **Textual Labels:**
* "Mitigation Strategies"
* "VM Migration, Current Limiting..."
* **Visual Components:**
* **Self-Healing Icon:** A heart symbol enclosed in circular "refresh" arrows, indicating a continuous recovery loop.
* **Action Flow:** Three dotted arrows radiate downward from the self-healing icon to specific mitigation actions:
1. **Cloud Download/Sync Icon:** Likely representing data backup or state synchronization.
2. **Server/VM Toggle Icon:** Representing VM Migration or resource adjustment.
3. **Cloud Power/Shutdown Icon:** Representing service restarts or current limiting.
* **Function:** The final stage executes automated strategies to resolve the issues identified in the previous steps.
---
## 3. Workflow Summary
The system operates in a unidirectional flow:
1. **Generate:** The **Cloud Service System** runs the workload.
2. **Observe:** The **Cloud Monitoring Backend** collects periodic KPI data.
3. **Analyze:** **KPI Correlation Analysis** filters data and identifies problematic VM candidates.
4. **Act:** **Cloud System Self Healing** applies mitigation strategies like migration or current limiting to restore system health.