## Line Graphs: Training Reward and AIME25 Performance
### Overview
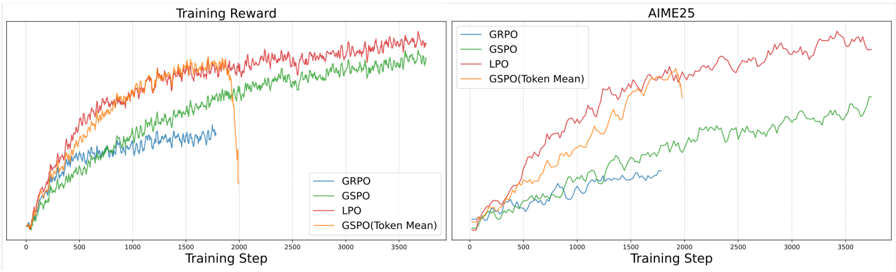
The image contains two side-by-side line graphs comparing the performance of four optimization methods (GRPO, GSPO, LPO, GSPO(Token Mean)) across training steps. The left graph tracks "Training Reward," while the right graph measures "AIME25" performance. Both graphs span 3,500 training steps on the x-axis, with y-axes representing respective metrics (unscaled).
---
### Components/Axes
1. **Left Graph (Training Reward)**:
- **X-axis**: "Training Step" (0–3,500, increments of 500).
- **Y-axis**: "Training Reward" (no numerical scale provided).
- **Legend**: Located in the bottom-left corner, mapping colors to methods:
- Blue: GRPO
- Green: GSPO
- Red: LPO
- Orange: GSPO(Token Mean)
2. **Right Graph (AIME25)**:
- **X-axis**: "Training Step" (0–3,500, increments of 500).
- **Y-axis**: "AIME25" (no numerical scale provided).
- **Legend**: Same color mappings as the left graph.
---
### Detailed Analysis
#### Left Graph (Training Reward)
1. **GRPO (Blue)**:
- Starts near 0, increases steadily with minor fluctuations.
- Reaches ~80% of its peak by 2,500 steps, then plateaus.
2. **GSPO (Green)**:
- Begins slightly above GRPO, grows steadily until ~1,500 steps.
- Sharp decline at ~2,000 steps, then recovers to match GRPO by 3,500.
3. **LPO (Red)**:
- Starts highest (~10% above GRPO/GSPO at step 0).
- Drops sharply at ~2,000 steps, then rises to surpass GRPO by 3,500.
4. **GSPO(Token Mean) (Orange)**:
- Smoothest curve, peaks at ~2,000 steps (~10% higher than GRPO).
- Declines steadily after 2,000 steps, ending ~5% below GRPO.
#### Right Graph (AIME25)
1. **GRPO (Blue)**:
- Starts near 0, rises steadily with minor noise.
- Reaches ~70% of its peak by 3,500 steps.
2. **GSPO (Green)**:
- Begins slightly above GRPO, grows until ~1,500 steps.
- Sharp drop at ~2,000 steps, then recovers to match GRPO by 3,500.
3. **LPO (Red)**:
- Starts highest (~15% above GRPO/GSPO at step 0).
- Dips sharply at ~2,000 steps, then rises to surpass GRPO by 3,500.
4. **GSPO(Token Mean) (Orange)**:
- Smooth curve, peaks at ~2,000 steps (~20% higher than GRPO).
- Declines steadily after 2,000 steps, ending ~10% below GRPO.
---
### Key Observations
1. **Consistent Trends**:
- GRPO and GSPO(Token Mean) show steady growth in both graphs.
- GSPO exhibits a sharp performance drop at ~2,000 steps in both metrics.
- LPO starts strong but underperforms after ~2,000 steps before recovering.
2. **Token Mean Impact**:
- GSPO(Token Mean) smooths volatility but peaks earlier (~2,000 steps) and declines faster than raw GSPO.
3. **Method Comparison**:
- LPO initially outperforms others but lags post-2,000 steps.
- GRPO maintains consistent growth, suggesting robustness.
- GSPO’s sharp drop may indicate instability or overfitting.
---
### Interpretation
The graphs highlight trade-offs between optimization methods:
- **GRPO** demonstrates stable, incremental improvement, ideal for consistent training.
- **GSPO**’s volatility (especially the 2,000-step drop) suggests sensitivity to hyperparameters or data shifts.
- **LPO**’s initial dominance followed by a dip implies potential overfitting early in training, with recovery suggesting adaptive mechanisms.
- **GSPO(Token Mean)** smooths performance but sacrifices late-stage gains, possibly due to averaging limiting adaptability.
The shared drop in GSPO at ~2,000 steps across both metrics hints at a systemic issue (e.g., learning rate decay, data exhaustion). The Token Mean variant’s earlier peak and decline suggest that smoothing may accelerate convergence but reduce long-term efficacy. These patterns underscore the importance of method selection based on training stability vs. peak performance goals.