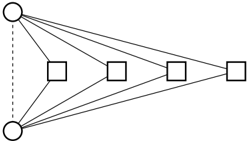
## Diagram: Bipartite Graph
### Overview
The image depicts a bipartite graph consisting of two sets of nodes: circles and squares. The circles are positioned on the left, and the squares are aligned horizontally on the right. Lines connect the circles to the squares, indicating relationships between them. One line between the two circles is dashed.
### Components/Axes
* **Nodes:**
* Circles: Two circles on the left side.
* Squares: Four squares on the right side.
* **Edges:**
* Solid Lines: Connect each circle to each of the four squares.
* Dashed Line: Connects the two circles.
### Detailed Analysis
* **Circle Nodes:** There are two circle nodes positioned vertically on the left side of the diagram.
* **Square Nodes:** There are four square nodes positioned horizontally on the right side of the diagram.
* **Connections:** Each circle node is connected to each of the four square nodes by a solid line. Additionally, the two circle nodes are connected to each other by a dashed line.
### Key Observations
* The graph is bipartite because it can be divided into two disjoint sets (circles and squares) such that every edge connects a node in one set to a node in the other set.
* The dashed line between the two circle nodes indicates a possible relationship or connection within the circle node set itself.
### Interpretation
The diagram represents a bipartite graph, a common structure in computer science and mathematics. The circles and squares represent different entities, and the lines represent relationships between them. The dashed line suggests a special relationship or connection between the two circle nodes, which might indicate a different type of interaction or a shared attribute. The graph could be used to model various scenarios, such as relationships between users and items in a recommendation system, or connections between variables and factors in a statistical model.