## Multi-Panel Figure: Curriculum Learning Performance
### Overview
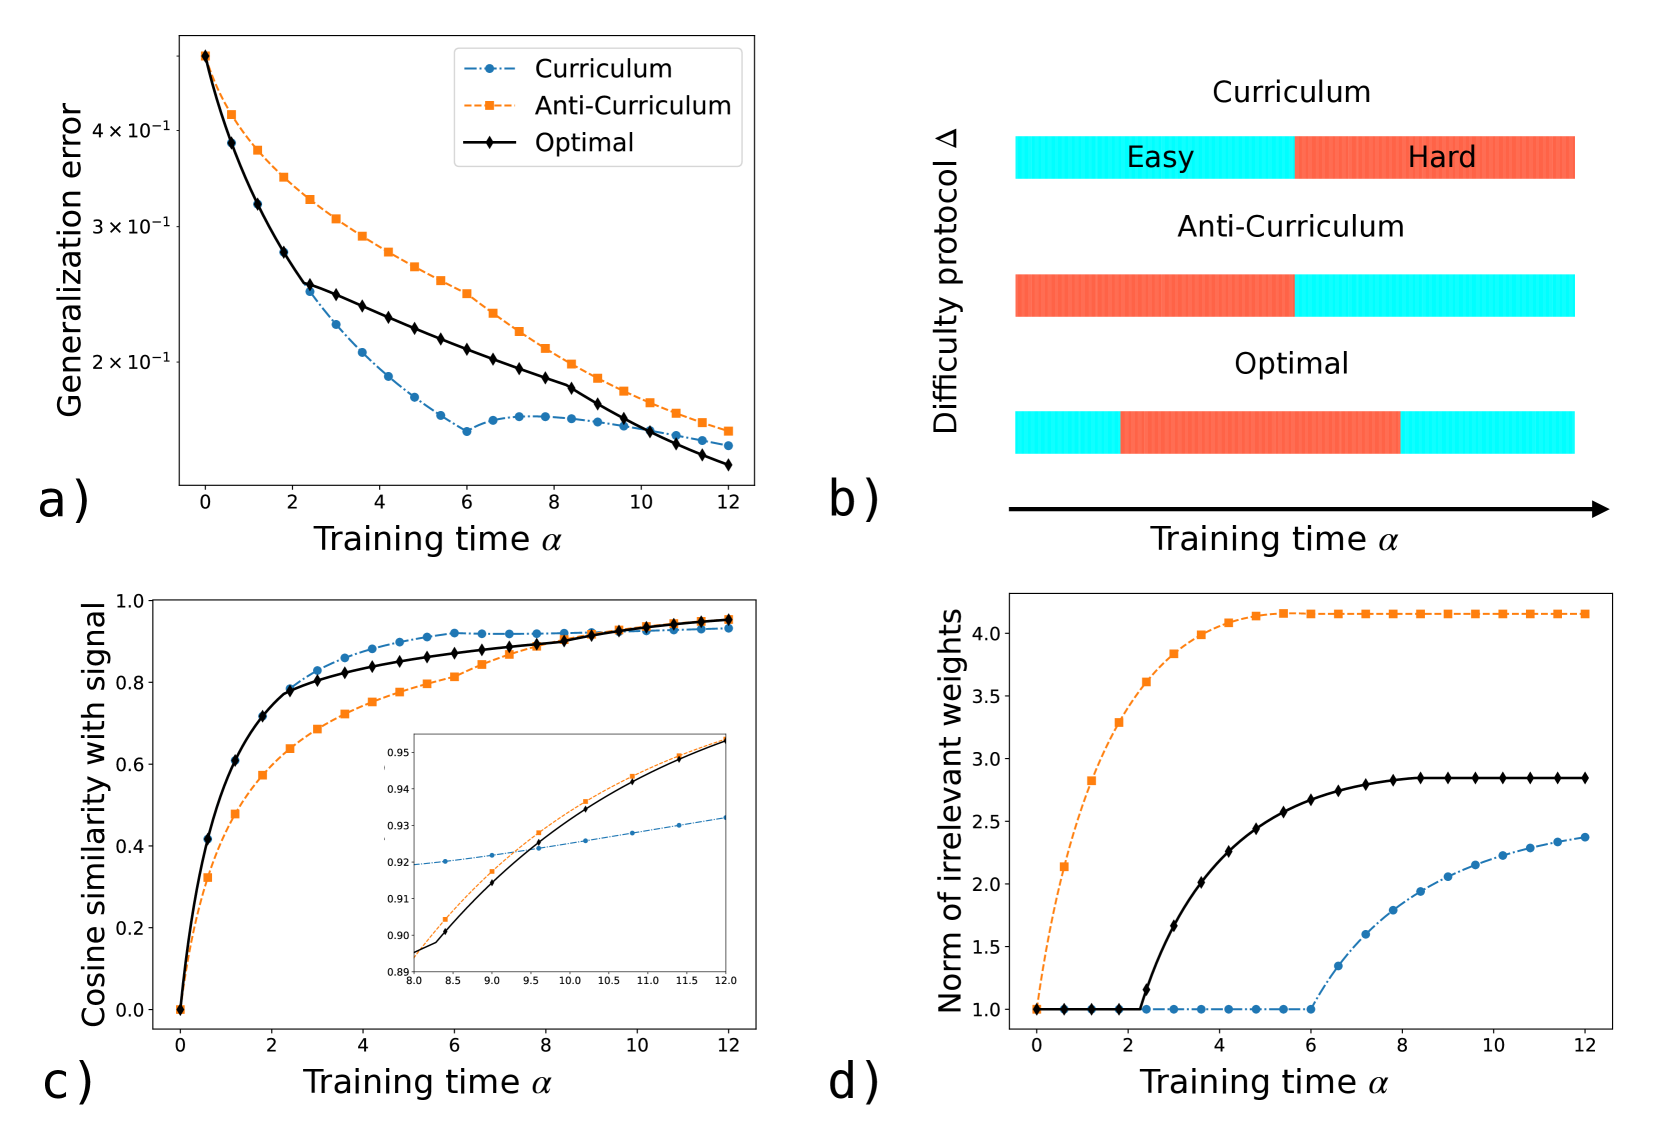
The image presents a multi-panel figure comparing the performance of three different training curricula: Curriculum, Anti-Curriculum, and Optimal. The figure consists of four subplots (a, b, c, d) that illustrate different aspects of the training process, including generalization error, difficulty protocol, cosine similarity with signal, and the norm of irrelevant weights.
### Components/Axes
**Panel a: Generalization Error vs. Training Time**
* **Y-axis:** Generalization error (log scale). Markers: 2 x 10^-1, 3 x 10^-1, 4 x 10^-1
* **X-axis:** Training time α. Markers: 0, 2, 4, 6, 8, 10, 12
* **Legend (top-left):**
* Curriculum (blue, dashed line with circle markers)
* Anti-Curriculum (orange, dashed line with square markers)
* Optimal (black, solid line with diamond markers)
**Panel b: Difficulty Protocol vs. Training Time**
* **Y-axis:** Difficulty protocol Δ
* **X-axis:** Training time α (arrow indicating direction)
* **Color Coding:**
* Easy (cyan)
* Hard (coral)
* **Curricula:**
* Curriculum: Easy initially, then Hard
* Anti-Curriculum: Hard initially, then Easy
* Optimal: Easy initially, then Hard, then Easy
**Panel c: Cosine Similarity with Signal vs. Training Time**
* **Y-axis:** Cosine similarity with signal. Markers: 0.0, 0.2, 0.4, 0.6, 0.8, 1.0
* **X-axis:** Training time α. Markers: 0, 2, 4, 6, 8, 10, 12
* **Inset Plot:** Zoomed-in view of the cosine similarity between training time 8 and 12.
* Y-axis markers: 0.89, 0.90, 0.91, 0.92, 0.93, 0.94, 0.95
* X-axis markers: 8.0, 8.5, 9.0, 9.5, 10.0, 10.5, 11.0, 11.5, 12.0
* **Legend (inferred from other plots):**
* Curriculum (blue, dashed line with circle markers)
* Anti-Curriculum (orange, dashed line with square markers)
* Optimal (black, solid line with diamond markers)
**Panel d: Norm of Irrelevant Weights vs. Training Time**
* **Y-axis:** Norm of irrelevant weights. Markers: 1.0, 1.5, 2.0, 2.5, 3.0, 3.5, 4.0
* **X-axis:** Training time α. Markers: 0, 2, 4, 6, 8, 10, 12
* **Legend (inferred from other plots):**
* Curriculum (blue, dashed line with circle markers)
* Anti-Curriculum (orange, dashed line with square markers)
* Optimal (black, solid line with diamond markers)
### Detailed Analysis
**Panel a: Generalization Error**
* **Curriculum (blue):** Starts at approximately 4.5 x 10^-1, decreases rapidly until training time ~6, then plateaus around 1.5 x 10^-1.
* **Anti-Curriculum (orange):** Starts at approximately 4.5 x 10^-1, decreases steadily to approximately 1.3 x 10^-1 at training time 12.
* **Optimal (black):** Starts at approximately 4.5 x 10^-1, decreases rapidly to approximately 1.5 x 10^-1 at training time 6, then decreases slowly to approximately 1.2 x 10^-1 at training time 12.
**Panel b: Difficulty Protocol**
* **Curriculum:** Starts with "Easy" tasks (cyan) for approximately half the training time, then switches to "Hard" tasks (coral).
* **Anti-Curriculum:** Starts with "Hard" tasks (coral) and switches to "Easy" tasks (cyan) after approximately one-third of the training time.
* **Optimal:** Starts with "Easy" tasks (cyan), switches to "Hard" tasks (coral) after a short period, and then switches back to "Easy" tasks (cyan).
**Panel c: Cosine Similarity with Signal**
* **Curriculum (blue):** Starts at 0, increases rapidly to approximately 0.8 by training time 4, then increases slowly to approximately 0.97 by training time 12.
* **Anti-Curriculum (orange):** Starts at 0, increases rapidly to approximately 0.7 by training time 4, then increases slowly to approximately 0.95 by training time 12.
* **Optimal (black):** Starts at 0, increases rapidly to approximately 0.85 by training time 4, then increases slowly to approximately 0.98 by training time 12.
* **Inset Plot:** Shows that the cosine similarity for Anti-Curriculum surpasses Curriculum after training time 10.
**Panel d: Norm of Irrelevant Weights**
* **Curriculum (blue):** Remains at approximately 1.0 until training time 6, then increases to approximately 2.2 by training time 12.
* **Anti-Curriculum (orange):** Increases rapidly from 1.0 to approximately 4.1 by training time 4, then plateaus.
* **Optimal (black):** Remains at approximately 1.0 until training time 2, then increases to approximately 2.8 by training time 12.
### Key Observations
* The "Optimal" curriculum achieves the lowest generalization error and highest cosine similarity with signal.
* The "Anti-Curriculum" results in the highest norm of irrelevant weights.
* The "Curriculum" shows a delayed increase in the norm of irrelevant weights.
### Interpretation
The data suggests that the order in which training tasks are presented significantly impacts the learning process. The "Optimal" curriculum, which starts with easy tasks, transitions to hard tasks, and then returns to easy tasks, appears to be the most effective in minimizing generalization error and maximizing the alignment of the learned representation with the signal. The "Anti-Curriculum," which starts with hard tasks, leads to a higher norm of irrelevant weights, potentially indicating that the model is learning spurious correlations early in training. The "Curriculum" approach, starting with easy tasks and then transitioning to hard tasks, shows a delayed increase in the norm of irrelevant weights, suggesting that it may be more robust to learning irrelevant features early on. The inset in panel c highlights a subtle but potentially important difference in the long-term behavior of the cosine similarity, where the Anti-Curriculum eventually surpasses the Curriculum. This could indicate that while the initial learning is slower, the Anti-Curriculum may eventually converge to a better solution.