## Bar Chart: Entity Frequency by Model
### Overview
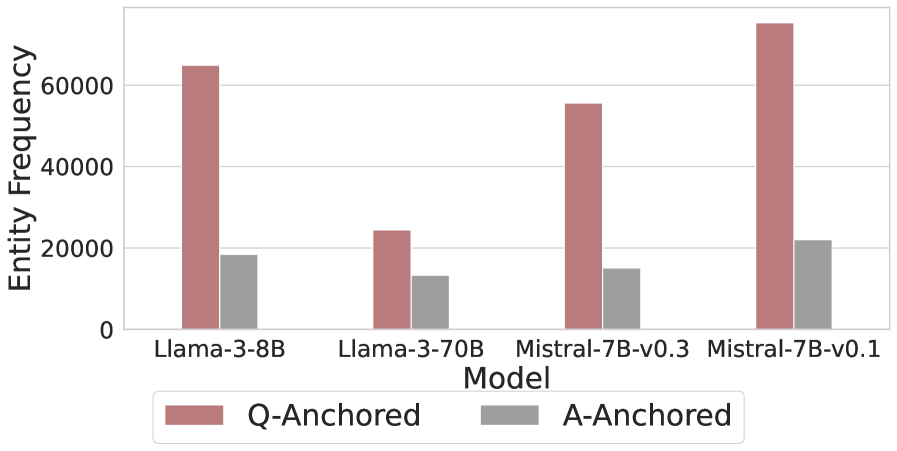
The image is a bar chart comparing the entity frequency of different language models, specifically Llama-3-8B, Llama-3-70B, Mistral-7B-v0.3, and Mistral-7B-v0.1. The chart displays two categories of entity frequency: "Q-Anchored" (represented by a light-red/brown color) and "A-Anchored" (represented by gray).
### Components/Axes
* **X-axis:** "Model" with categories: Llama-3-8B, Llama-3-70B, Mistral-7B-v0.3, Mistral-7B-v0.1
* **Y-axis:** "Entity Frequency" with a numerical scale from 0 to 60000, with tick marks at 20000, 40000, and 60000.
* **Legend:** Located at the bottom of the chart.
* Light-red/brown: "Q-Anchored"
* Gray: "A-Anchored"
### Detailed Analysis
* **Llama-3-8B:**
* Q-Anchored: Approximately 63000
* A-Anchored: Approximately 18000
* **Llama-3-70B:**
* Q-Anchored: Approximately 24000
* A-Anchored: Approximately 13000
* **Mistral-7B-v0.3:**
* Q-Anchored: Approximately 56000
* A-Anchored: Approximately 15000
* **Mistral-7B-v0.1:**
* Q-Anchored: Approximately 73000
* A-Anchored: Approximately 22000
### Key Observations
* For all models, the "Q-Anchored" entity frequency is significantly higher than the "A-Anchored" entity frequency.
* Mistral-7B-v0.1 has the highest "Q-Anchored" entity frequency among the models.
* Llama-3-70B has the lowest "Q-Anchored" and "A-Anchored" entity frequencies.
### Interpretation
The chart suggests that "Q-Anchored" entities are more frequent than "A-Anchored" entities across all the evaluated language models. The difference in frequency between the two categories varies among the models, with Mistral-7B-v0.1 showing the highest overall entity frequency and Llama-3-70B showing the lowest. This could indicate differences in how these models process or generate "Q-Anchored" versus "A-Anchored" entities, potentially reflecting variations in their training data or architectural design.