## Stacked Bar Chart: Latency Distribution by Model Configuration
### Overview
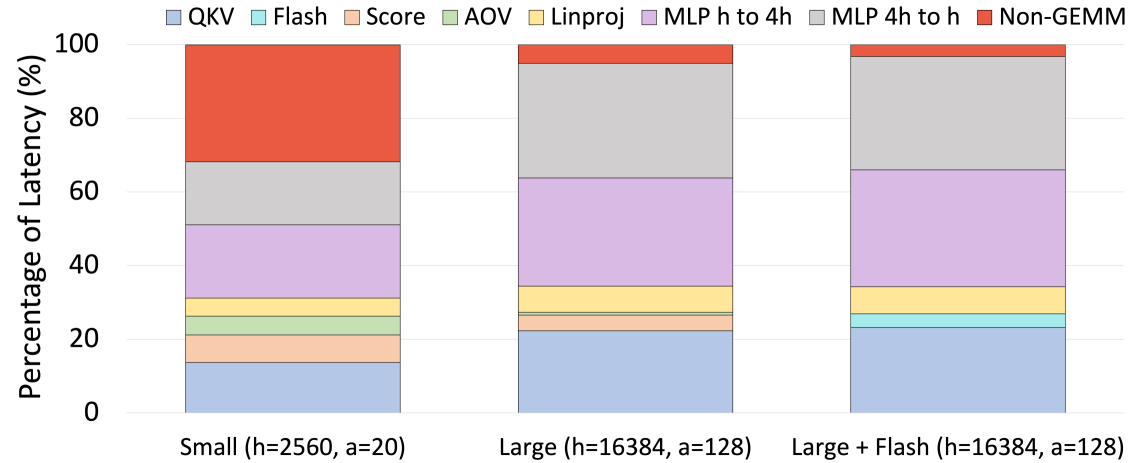
This image displays a stacked bar chart comparing the percentage of latency attributed to various computational components across three different model configurations. The chart illustrates how the distribution of latency shifts as model size increases and when specific optimizations (Flash) are applied.
### Components/Axes
* **Y-Axis:** "Percentage of Latency (%)", ranging from 0 to 100.
* **X-Axis:** Three distinct model configurations:
1. **Small (h=2560, a=20)**
2. **Large (h=16384, a=128)**
3. **Large + Flash (h=16384, a=128)**
* **Legend (Top):**
* **QKV:** Light Blue
* **Flash:** Cyan
* **Score:** Peach
* **AOV:** Light Green
* **Linproj:** Yellow
* **MLP h to 4h:** Light Purple
* **MLP 4h to h:** Light Grey
* **Non-GEMM:** Red
### Detailed Analysis
The chart is divided into three vertical bars, each representing 100% of the latency for that specific configuration.
#### 1. Small (h=2560, a=20)
* **Trend:** This bar is dominated by the "Non-GEMM" component at the top.
* **Data Points (approximate):**
* **Non-GEMM (Red):** ~32% (occupies the top segment, from ~68% to 100%)
* **MLP 4h to h (Grey):** ~17% (from ~51% to 68%)
* **MLP h to 4h (Purple):** ~20% (from ~31% to 51%)
* **Linproj (Yellow):** ~5% (from ~26% to 31%)
* **AOV (Green):** ~5% (from ~21% to 26%)
* **Score (Peach):** ~7% (from ~14% to 21%)
* **QKV (Blue):** ~14% (from 0% to 14%)
#### 2. Large (h=16384, a=128)
* **Trend:** The "Non-GEMM" component shrinks drastically compared to the Small model. The MLP components (Purple and Grey) become the dominant contributors to latency.
* **Data Points (approximate):**
* **Non-GEMM (Red):** ~5% (from ~95% to 100%)
* **MLP 4h to h (Grey):** ~31% (from ~64% to 95%)
* **MLP h to 4h (Purple):** ~30% (from ~34% to 64%)
* **Linproj (Yellow):** ~8% (from ~26% to 34%)
* **AOV (Green):** ~1% (from ~25% to 26%)
* **Score (Peach):** ~3% (from ~22% to 25%)
* **QKV (Blue):** ~22% (from 0% to 22%)
#### 3. Large + Flash (h=16384, a=128)
* **Trend:** Very similar to the "Large" configuration, but with the introduction of a "Flash" component.
* **Data Points (approximate):**
* **Non-GEMM (Red):** ~3% (from ~97% to 100%)
* **MLP 4h to h (Grey):** ~31% (from ~66% to 97%)
* **MLP h to 4h (Purple):** ~32% (from ~34% to 66%)
* **Linproj (Yellow):** ~5% (from ~29% to 34%)
* **AOV (Green):** ~1% (from ~28% to 29%)
* **Score (Peach):** ~1% (from ~27% to 28%)
* **Flash (Cyan):** ~4% (from ~23% to 27%)
* **QKV (Blue):** ~23% (from 0% to 23%)
### Key Observations
* **Non-GEMM Bottleneck:** In the "Small" model, "Non-GEMM" operations are the single largest source of latency. As the model scales to "Large," this component becomes negligible.
* **MLP Dominance:** In larger models, the two MLP (Multi-Layer Perceptron) components ("h to 4h" and "4h to h") combined account for over 60% of the total latency.
* **QKV Scaling:** The latency contribution of the "QKV" component increases as the model size increases (from ~14% to ~23%).
* **Flash Integration:** The "Flash" component (likely referring to FlashAttention) appears only in the third configuration, consuming a small portion (~4%) of the latency budget, effectively displacing some of the "Linproj" and "Score" latency.
### Interpretation
This data suggests a fundamental shift in computational bottlenecks as Transformer models scale.
1. **Small Models are Memory/Overhead Bound:** The high percentage of "Non-GEMM" latency in the "Small" model suggests that for smaller hidden dimensions, the overhead of launching kernels, memory movement, or non-matrix-multiplication operations dominates the execution time.
2. **Large Models are Compute Bound:** In the "Large" configuration, the dominance of the MLP layers (which are typically heavy GEMM/Matrix Multiplication operations) indicates that the model is compute-bound. The hardware is spending the vast majority of its time performing the heavy lifting of the neural network layers rather than managing overhead.
3. **Optimization Efficacy:** The "Large + Flash" configuration demonstrates that introducing specialized kernels (like FlashAttention) allows for a slight redistribution of latency, but the overall profile remains dominated by the MLP layers. This confirms that for large models, optimizing the MLP layers is the most critical path for performance improvement.