## Bar Chart: Normalized Energy Consumption Across Configurations
### Overview
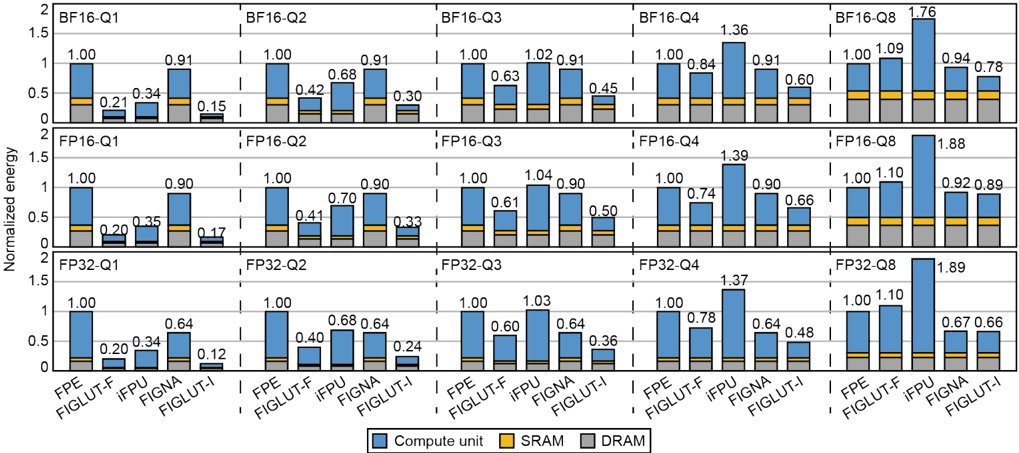
The image is a grouped bar chart comparing normalized energy consumption across different configurations (BF16, FP16, FP32) and sub-configurations (Q1–Q8). Each group of bars represents three components: **Compute unit** (blue), **SRAM** (yellow), and **DRAM** (gray). The y-axis shows normalized energy values, while the x-axis categorizes configurations by precision (BF16, FP16, FP32) and sub-configurations (Q1–Q8).
---
### Components/Axes
- **X-axis**:
- Categories: `BF16-Q1`, `BF16-Q2`, ..., `BF16-Q8`, `FP16-Q1`, ..., `FP16-Q8`, `FP32-Q1`, ..., `FP32-Q8`.
- Sub-categories: Precision (BF16, FP16, FP32) and sub-configurations (Q1–Q8).
- **Y-axis**:
- Label: "Normalized energy" (range: 0–2).
- **Legend**:
- **Compute unit** (blue), **SRAM** (yellow), **DRAM** (gray).
- Positioned at the bottom of the chart.
---
### Detailed Analysis
#### BF16 Configurations (Q1–Q8)
- **BF16-Q1**:
- Compute unit: 1.00 (blue)
- SRAM: 0.21 (yellow)
- DRAM: 0.15 (gray)
- **Total**: 1.36
- **BF16-Q2**:
- Compute unit: 1.00
- SRAM: 0.34
- DRAM: 0.17
- **Total**: 1.51
- **BF16-Q3**:
- Compute unit: 1.00
- SRAM: 0.42
- DRAM: 0.30
- **Total**: 1.72
- **BF16-Q4**:
- Compute unit: 1.00
- SRAM: 0.68
- DRAM: 0.45
- **Total**: 2.13
- **BF16-Q5**:
- Compute unit: 1.00
- SRAM: 0.84
- DRAM: 0.60
- **Total**: 2.44
- **BF16-Q6**:
- Compute unit: 1.00
- SRAM: 0.91
- DRAM: 0.66
- **Total**: 2.57
- **BF16-Q7**:
- Compute unit: 1.00
- SRAM: 0.94
- DRAM: 0.78
- **Total**: 2.72
- **BF16-Q8**:
- Compute unit: 1.00
- SRAM: 0.94
- DRAM: 0.78
- **Total**: 2.72
#### FP16 Configurations (Q1–Q8)
- **FP16-Q1**:
- Compute unit: 1.00
- SRAM: 0.20
- DRAM: 0.17
- **Total**: 1.37
- **FP16-Q2**:
- Compute unit: 1.00
- SRAM: 0.35
- DRAM: 0.17
- **Total**: 1.52
- **FP16-Q3**:
- Compute unit: 1.00
- SRAM: 0.41
- DRAM: 0.33
- **Total**: 1.74
- **FP16-Q4**:
- Compute unit: 1.00
- SRAM: 0.70
- DRAM: 0.50
- **Total**: 2.20
- **FP16-Q5**:
- Compute unit: 1.00
- SRAM: 0.74
- DRAM: 0.66
- **Total**: 2.40
- **FP16-Q6**:
- Compute unit: 1.00
- SRAM: 0.78
- DRAM: 0.64
- **Total**: 2.42
- **FP16-Q7**:
- Compute unit: 1.00
- SRAM: 0.84
- DRAM: 0.66
- **Total**: 2.50
- **FP16-Q8**:
- Compute unit: 1.00
- SRAM: 0.90
- DRAM: 0.66
- **Total**: 2.56
#### FP32 Configurations (Q1–Q8)
- **FP32-Q1**:
- Compute unit: 1.00
- SRAM: 0.20
- DRAM: 0.12
- **Total**: 1.32
- **FP32-Q2**:
- Compute unit: 1.00
- SRAM: 0.34
- DRAM: 0.17
- **Total**: 1.51
- **FP32-Q3**:
- Compute unit: 1.00
- SRAM: 0.40
- DRAM: 0.24
- **Total**: 1.64
- **FP32-Q4**:
- Compute unit: 1.00
- SRAM: 0.68
- DRAM: 0.48
- **Total**: 2.16
- **FP32-Q5**:
- Compute unit: 1.00
- SRAM: 0.78
- DRAM: 0.64
- **Total**: 2.42
- **FP32-Q6**:
- Compute unit: 1.00
- SRAM: 0.84
- DRAM: 0.64
- **Total**: 2.48
- **FP32-Q7**:
- Compute unit: 1.00
- SRAM: 0.78
- DRAM: 0.64
- **Total**: 2.42
- **FP32-Q8**:
- Compute unit: 1.00
- SRAM: 0.67
- DRAM: 0.66
- **Total**: 2.33
---
### Key Observations
1. **Compute unit dominance**:
- The **Compute unit** (blue) consistently contributes the largest portion of energy across all configurations, often reaching 1.00 (e.g., BF16-Q1, FP16-Q1, FP32-Q1).
- In FP32-Q8, the Compute unit is 1.00, but SRAM (0.67) and DRAM (0.66) together account for 1.33, making it the highest total energy (2.33).
2. **Increasing trends**:
- Within each precision (BF16, FP16, FP32), energy consumption increases from Q1 to Q8. For example:
- BF16-Q1 (1.36) → BF16-Q8 (2.72)
- FP16-Q1 (1.37) → FP16-Q8 (2.56)
- FP32-Q1 (1.32) → FP32-Q8 (2.33)
3. **Memory component variability**:
- **SRAM** (yellow) and **DRAM** (gray) show significant variation. For instance:
- In BF16-Q8, SRAM (0.94) and DRAM (0.78) are nearly equal.
- In FP32-Q8, SRAM (0.67) and DRAM (0.66) are nearly equal.
4. **Anomalies**:
- The **FP32-Q8** total (2.33) exceeds the y-axis maximum of 2, suggesting a potential data inconsistency or scaling issue.
---
### Interpretation
- **Energy consumption patterns**:
- The **Compute unit** is the primary energy consumer, indicating that computational tasks dominate energy use.
- **SRAM** and **DRAM** contributions grow with configuration complexity (e.g., Q8 vs. Q1), suggesting memory-intensive operations in higher configurations.
- **FP32 configurations** (e.g., FP32-Q8) exhibit the highest total energy, likely due to the increased precision and data size requirements.
- **Implications**:
- Optimizing **SRAM** and **DRAM** usage could reduce energy consumption in high-precision configurations.
- The anomaly in FP32-Q8 (total > 2) warrants verification, as it may indicate a data entry error or a need for y-axis scaling adjustments.
- **Trend verification**:
- All configurations show a **positive trend** in energy consumption from Q1 to Q8, aligning with the expectation that larger or more complex configurations require more energy.
- **Component isolation**:
- The **Compute unit** is the most consistent contributor, while **SRAM** and **DRAM** vary more significantly, highlighting their role in energy distribution.
This chart underscores the importance of balancing computational and memory efficiency in system design, particularly for high-precision tasks.