## Line Chart: Run family (loops) Accuracy vs. Training Samples
### Overview
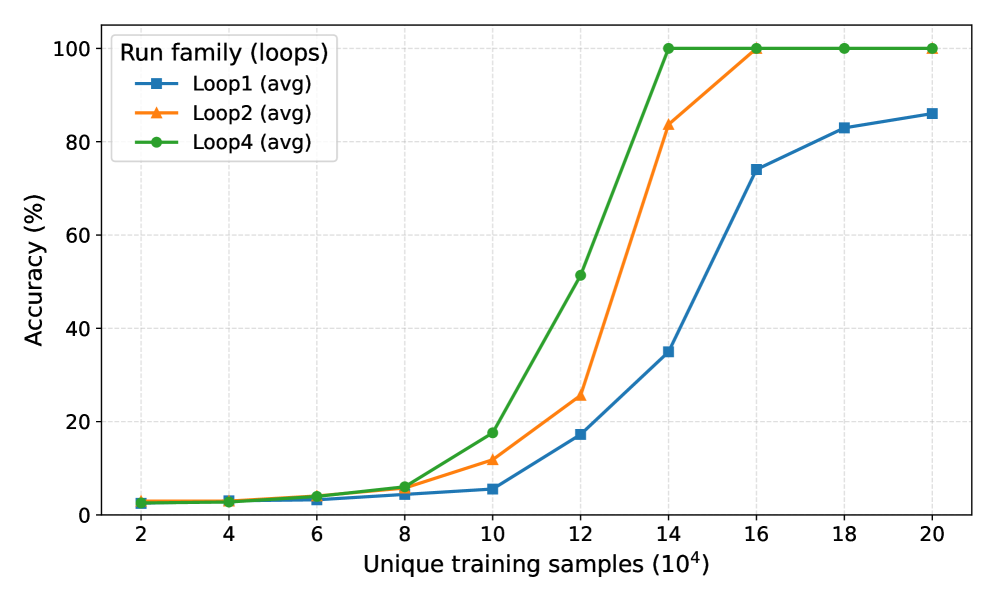
The chart illustrates the average accuracy (%) of three training loops (Loop1, Loop2, Loop4) as a function of unique training samples (in thousands). All loops show increasing accuracy with more training data, but with distinct performance trajectories.
### Components/Axes
- **X-axis**: Unique training samples (10⁴), labeled at intervals: 2, 4, 6, 8, 10, 12, 14, 16, 18, 20 (each ×10⁴).
- **Y-axis**: Accuracy (%), scaled from 0 to 100 in 20% increments.
- **Legend**: Located in the top-left corner, mapping:
- Blue squares: Loop1 (avg)
- Orange triangles: Loop2 (avg)
- Green circles: Loop4 (avg)
### Detailed Analysis
1. **Loop1 (blue squares)**:
- Starts at ~2% accuracy at 2k samples.
- Gradual increase to ~8% at 10k samples.
- Sharp rise to ~75% at 14k samples.
- Further increase to ~85% at 20k samples.
- *Trend*: Slow initial growth, rapid acceleration after 14k samples.
2. **Loop2 (orange triangles)**:
- Begins at ~2% at 2k samples.
- Steeper ascent to ~12% at 10k samples.
- Explosive growth to 100% at 14k samples.
- Remains at 100% through 20k samples.
- *Trend*: Rapid early improvement, plateau at maximum accuracy.
3. **Loop4 (green circles)**:
- Starts slightly higher (~3%) than Loop1 at 2k samples.
- Accelerates to ~18% at 10k samples.
- Reaches 100% at 14k samples.
- Maintains 100% through 20k samples.
- *Trend*: Faster initial growth than Loop1, early saturation.
### Key Observations
- **Saturation Point**: Loop2 and Loop4 achieve 100% accuracy at 14k samples, while Loop1 lags until 16k+.
- **Divergence**: Loop2 outperforms Loop4 in early stages (e.g., 10k samples: 12% vs. 18%).
- **Consistency**: All loops plateau at 100% after 14k samples, suggesting diminishing returns beyond this point.
### Interpretation
The data demonstrates that **Loop2 and Loop4** are more sample-efficient, achieving near-perfect accuracy with fewer training examples compared to Loop1. This could indicate:
- **Algorithmic Efficiency**: Loop2/Loop4 may use more effective optimization or regularization techniques.
- **Data Utilization**: These loops might better leverage training data through architectural choices (e.g., attention mechanisms, ensemble methods).
- **Loop1 Limitations**: Its slower convergence suggests potential overfitting risks or suboptimal hyperparameter tuning.
The plateau at 100% for Loop2/Loop4 implies these models reach theoretical maximum performance for the dataset, while Loop1’s continued improvement hints at either:
1. A less robust model architecture, or
2. A dataset where additional samples still provide marginal gains.
This analysis underscores the importance of loop design in training efficiency and highlights trade-offs between sample complexity and model performance.