TECHNICAL ASSET FINGERPRINT
361fbf1e6d6473ed00d3ccc0
Click to view fullscreen
Press ESC or click to close
FOUND IN PAPERS
EXPERT: gemini-2.5-flash-free VERSION 1
RUNTIME: google-free/gemini-2.5-flash
INTEL_VERIFIED
## Chart Type: Heatmap of Performance Metric vs. Program Parameters
### Overview
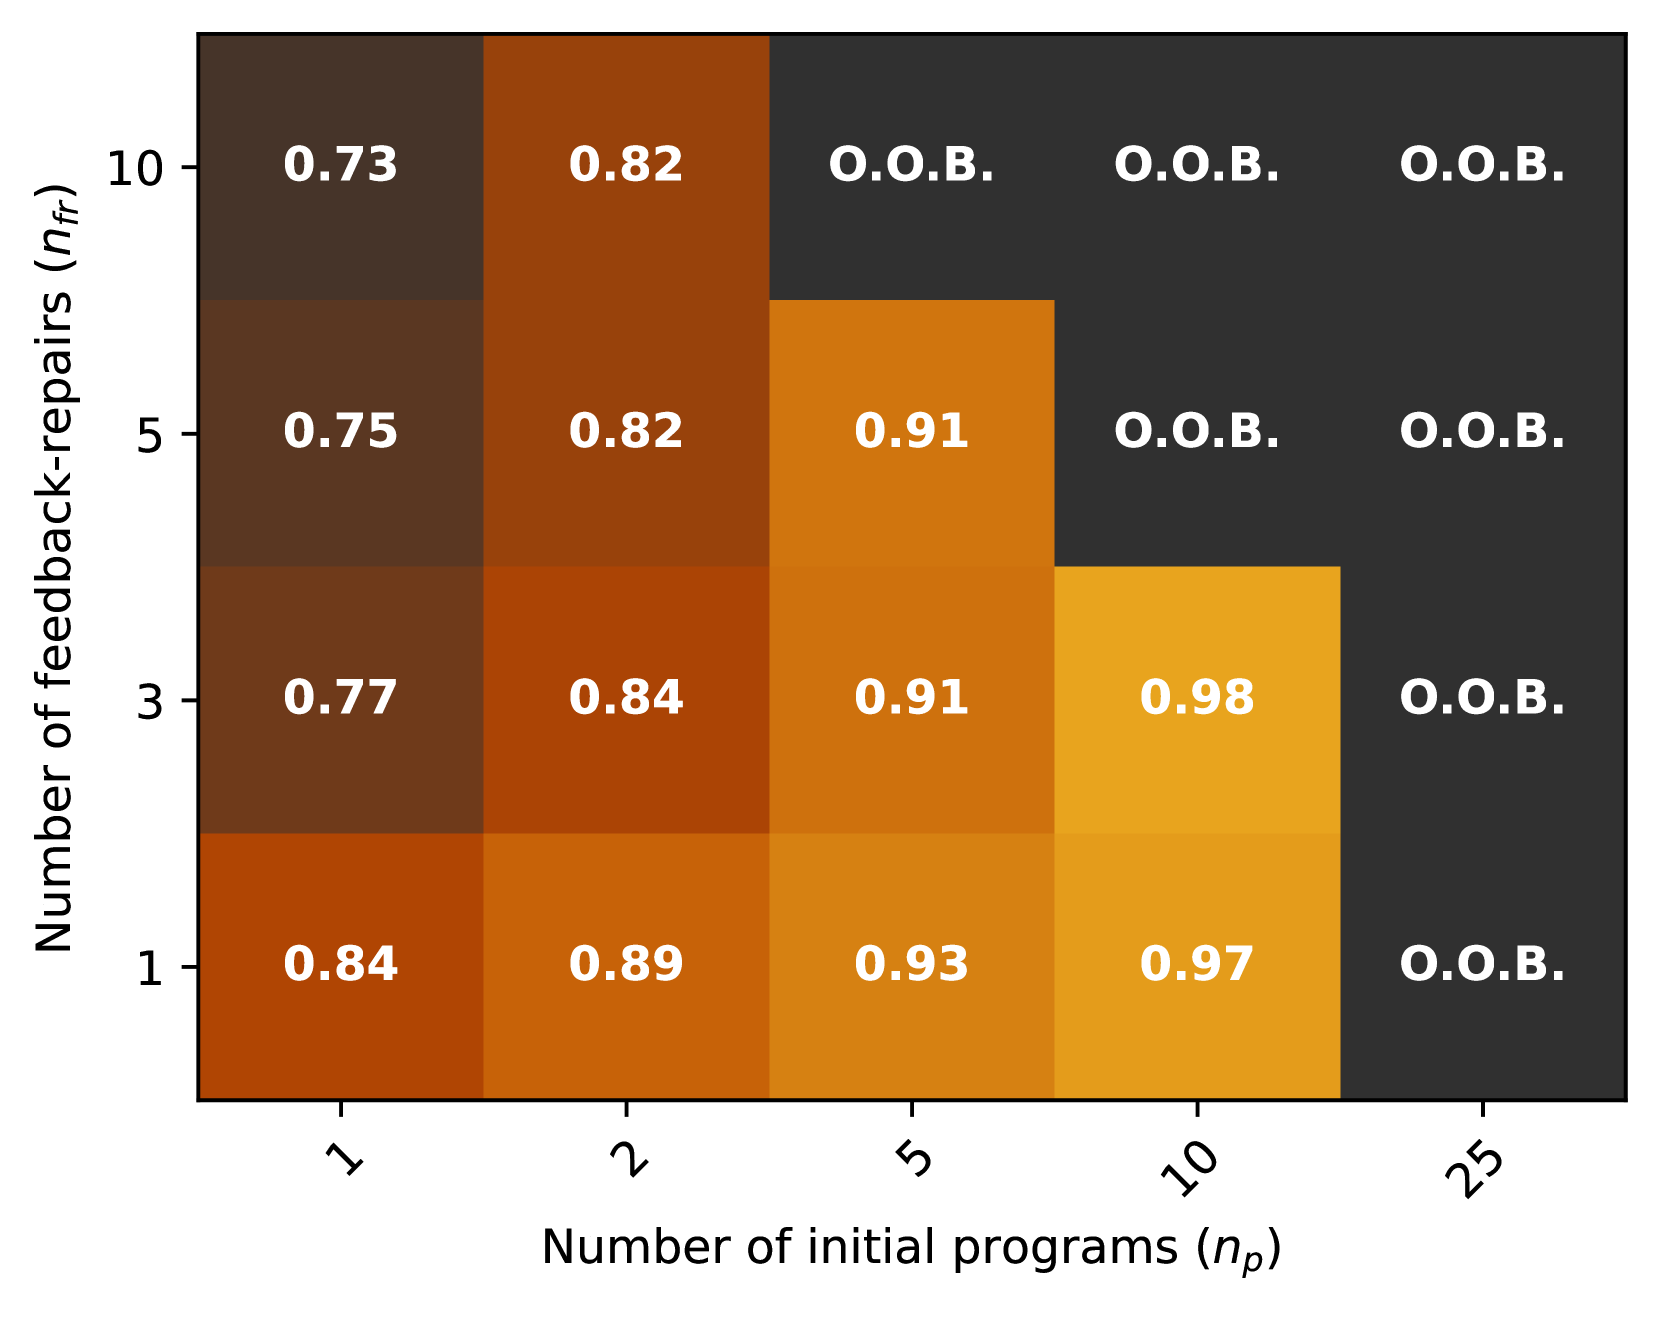
This image displays a heatmap illustrating the relationship between two parameters, "Number of feedback-repairs ($n_{fr}$)" and "Number of initial programs ($n_P$)", and an associated performance metric. The performance metric is represented by numerical values ranging from approximately 0.73 to 0.98, with higher values indicated by brighter orange/yellow colors and lower values by darker brown colors. Certain parameter combinations are marked as "O.O.B." (Out Of Bounds), shown in dark grey.
### Components/Axes
The heatmap is structured with a vertical Y-axis on the left and a horizontal X-axis at the bottom.
* **Y-axis (Left)**:
* **Title**: "Number of feedback-repairs ($n_{fr}$)"
* **Tick Markers**: 10, 5, 3, 1 (from top to bottom, indicating decreasing values).
* **X-axis (Bottom)**:
* **Title**: "Number of initial programs ($n_P$)"
* **Tick Markers**: 1, 2, 5, 10, 25 (from left to right, indicating increasing values).
* **Data Grid**: The central area of the chart is a 4x5 grid of cells, each representing a unique combination of $n_{fr}$ and $n_P$. Each cell contains either a numerical value (a performance score) or the text "O.O.B.".
* **Color Gradient**: The numerical values are color-coded:
* Darkest brown: Approximately 0.73 - 0.77
* Medium brown: Approximately 0.82 - 0.84
* Orange-brown: Approximately 0.89
* Orange: Approximately 0.91 - 0.93
* Bright orange/yellow: Approximately 0.97 - 0.98
* Dark grey: "O.O.B."
### Detailed Analysis
The data from the heatmap can be reconstructed into the following table, showing the performance metric for each combination of $n_{fr}$ and $n_P$:
| $n_{fr}$ \ $n_P$ | 1 | 2 | 5 | 10 | 25 |
| :--------------- | :----- | :----- | :----- | :----- | :----- |
| **10** | 0.73 | 0.82 | O.O.B. | O.O.B. | O.O.B. |
| **5** | 0.75 | 0.82 | 0.91 | O.O.B. | O.O.B. |
| **3** | 0.77 | 0.84 | 0.91 | 0.98 | O.O.B. |
| **1** | 0.84 | 0.89 | 0.93 | 0.97 | O.O.B. |
**Trends by Row (Constant $n_{fr}$, Increasing $n_P$):**
* **$n_{fr}=10$**: The value increases from 0.73 (dark brown) at $n_P=1$ to 0.82 (medium brown) at $n_P=2$. For $n_P \ge 5$, the state is "O.O.B." (dark grey).
* **$n_{fr}=5$**: The value increases from 0.75 (dark brown) at $n_P=1$ to 0.82 (medium brown) at $n_P=2$, then to 0.91 (orange) at $n_P=5$. For $n_P \ge 10$, the state is "O.O.B." (dark grey).
* **$n_{fr}=3$**: The value increases from 0.77 (dark brown) at $n_P=1$ to 0.84 (medium brown) at $n_P=2$, then to 0.91 (orange) at $n_P=5$, and reaches its peak at 0.98 (bright orange/yellow) at $n_P=10$. For $n_P=25$, the state is "O.O.B." (dark grey).
* **$n_{fr}=1$**: The value increases from 0.84 (medium brown) at $n_P=1$ to 0.89 (orange-brown) at $n_P=2$, then to 0.93 (orange) at $n_P=5$, and to 0.97 (bright orange/yellow) at $n_P=10$. For $n_P=25$, the state is "O.O.B." (dark grey).
**Trends by Column (Constant $n_P$, Decreasing $n_{fr}$):**
* **$n_P=1$**: The value generally increases as $n_{fr}$ decreases: 0.73 ($n_{fr}=10$) -> 0.75 ($n_{fr}=5$) -> 0.77 ($n_{fr}=3$) -> 0.84 ($n_{fr}=1$).
* **$n_P=2$**: The value generally increases as $n_{fr}$ decreases: 0.82 ($n_{fr}=10$) -> 0.82 ($n_{fr}=5$) -> 0.84 ($n_{fr}=3$) -> 0.89 ($n_{fr}=1$).
* **$n_P=5$**: The value generally increases as $n_{fr}$ decreases: "O.O.B." ($n_{fr}=10$) -> 0.91 ($n_{fr}=5$) -> 0.91 ($n_{fr}=3$) -> 0.93 ($n_{fr}=1$).
* **$n_P=10$**: The value generally increases as $n_{fr}$ decreases: "O.O.B." ($n_{fr}=10$) -> "O.O.B." ($n_{fr}=5$) -> 0.98 ($n_{fr}=3$) -> 0.97 ($n_{fr}=1$). Note a slight decrease from 0.98 to 0.97 for $n_{fr}=3$ to $n_{fr}=1$.
* **$n_P=25$**: All values are "O.O.B." for all $n_{fr}$ values shown.
### Key Observations
* **Performance Gradient**: There is a clear visual gradient indicating that performance generally improves (values increase) as $n_{fr}$ decreases and $n_P$ increases, within the region where data is available. The highest values are found towards the bottom-right of the non-"O.O.B." region.
* **Optimal Point**: The highest recorded performance metric is 0.98, achieved at $n_{fr}=3$ and $n_P=10$.
* **"O.O.B." Region**: A significant portion of the heatmap, particularly the top-right triangular area, is marked "O.O.B.". This indicates that combinations with a high number of initial programs (e.g., $n_P=25$) or a high number of feedback-repairs combined with moderate to high initial programs (e.g., $n_{fr}=10$ with $n_P \ge 5$) are not valid or were not evaluated.
* **Diminishing Returns/Plateau**: While performance generally increases, the change from 0.98 to 0.97 when moving from ($n_{fr}=3, n_P=10$) to ($n_{fr}=1, n_P=10$) suggests that further reducing feedback-repairs beyond a certain point might not yield significant improvements or could even slightly decrease performance.
### Interpretation
This heatmap demonstrates the sensitivity of a system's performance to the "Number of feedback-repairs ($n_{fr}$)" and "Number of initial programs ($n_P$)".
The data suggests that:
1. **Increasing Initial Programs Generally Helps**: For a given number of feedback-repairs, increasing the number of initial programs ($n_P$) tends to improve performance, up to a certain threshold. For example, with $n_{fr}=1$, performance rises from 0.84 to 0.97 as $n_P$ increases from 1 to 10.
2. **Decreasing Feedback-Repairs Generally Helps**: For a given number of initial programs, decreasing the number of feedback-repairs ($n_{fr}$) also tends to improve performance. For instance, with $n_P=1$, performance increases from 0.73 to 0.84 as $n_{fr}$ decreases from 10 to 1.
3. **Optimal Parameter Balance**: The peak performance of 0.98 is achieved at an intermediate number of feedback-repairs ($n_{fr}=3$) and a relatively high number of initial programs ($n_P=10$). This indicates that there might be an optimal balance between these two parameters, rather than simply maximizing one and minimizing the other.
4. **System Constraints or Infeasibility ("O.O.B.")**: The "O.O.B." region is critical. It implies that certain combinations of parameters are either computationally infeasible, resource-intensive beyond practical limits, or lead to an invalid state for the system. Specifically, very high numbers of initial programs ($n_P=25$) seem to be universally "O.O.B." for all tested $n_{fr}$ values. Similarly, high $n_{fr}$ values (e.g., $n_{fr}=10$) quickly lead to "O.O.B." conditions when $n_P$ increases beyond 2. This suggests that the system might struggle or become unstable when both parameters are high, or when $n_P$ is excessively large.
5. **Practical Implications**: For system designers or users, this heatmap provides guidance on selecting parameters to achieve high performance while avoiding "out of bounds" conditions. Focusing on $n_P$ values around 5-10 and $n_{fr}$ values around 1-3 appears to be the most effective strategy based on this data.
DECODING INTELLIGENCE...