## Heatmap: Comparison of Digit Distributions Before and After GRPO
### Overview
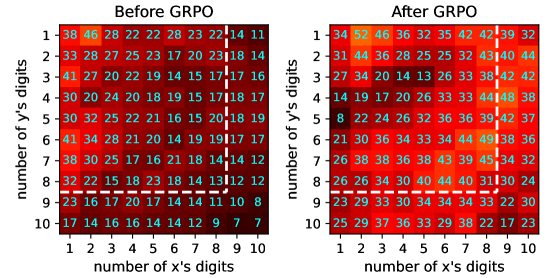
This image presents two heatmaps side-by-side, visually comparing the distribution of digits 'x' and 'y' before and after a process labeled "GRPO". Each heatmap represents a 10x10 grid, where the x-axis represents the number of digits 'x', and the y-axis represents the number of digits 'y'. The color intensity within each cell indicates a numerical value, with warmer colors (reds) representing higher values and cooler colors (blues) representing lower values.
### Components/Axes
* **Title (Left):** "Before GRPO"
* **Title (Right):** "After GRPO"
* **X-axis Label (Both):** "number of x's digits" (ranging from 1 to 10)
* **Y-axis Label (Both):** "number of y's digits" (ranging from 1 to 10)
* **Color Scale:** A gradient from dark blue (low values) to bright red (high values). The exact scale is not provided, but values are displayed within each cell.
* **Grid:** 10 rows and 10 columns in each heatmap.
### Detailed Analysis or Content Details
**Left Heatmap (Before GRPO):**
The heatmap shows a general trend of decreasing values as both the number of 'x' digits and the number of 'y' digits increase. The highest values are concentrated in the top-left corner.
* **Row 1:** Values decrease from 38 (x=1, y=1) to 11 (x=10, y=1).
* **Row 2:** Values decrease from 33 (x=1, y=2) to 14 (x=10, y=2).
* **Row 3:** Values decrease from 41 (x=1, y=3) to 16 (x=10, y=3).
* **Row 4:** Values decrease from 30 (x=1, y=4) to 17 (x=10, y=4).
* **Row 5:** Values decrease from 30 (x=1, y=5) to 19 (x=10, y=5).
* **Row 6:** Values decrease from 41 (x=1, y=6) to 17 (x=10, y=6).
* **Row 7:** Values decrease from 38 (x=1, y=7) to 12 (x=10, y=7).
* **Row 8:** Values decrease from 32 (x=1, y=8) to 12 (x=10, y=8).
* **Row 9:** Values decrease from 23 (x=1, y=9) to 8 (x=10, y=9).
* **Row 10:** Values decrease from 17 (x=1, y=10) to 7 (x=10, y=10).
**Right Heatmap (After GRPO):**
The heatmap shows a different distribution compared to the "Before GRPO" heatmap. The highest values are more dispersed, and there's a noticeable increase in values along the diagonal and in the upper-right corner.
* **Row 1:** Values decrease from 52 (x=1, y=1) to 32 (x=10, y=1).
* **Row 2:** Values decrease from 44 (x=1, y=2) to 44 (x=10, y=2).
* **Row 3:** Values decrease from 34 (x=1, y=3) to 42 (x=10, y=3).
* **Row 4:** Values decrease from 19 (x=1, y=4) to 38 (x=10, y=4).
* **Row 5:** Values decrease from 22 (x=1, y=5) to 37 (x=10, y=5).
* **Row 6:** Values decrease from 21 (x=1, y=6) to 36 (x=10, y=6).
* **Row 7:** Values decrease from 38 (x=1, y=7) to 34 (x=10, y=7).
* **Row 8:** Values decrease from 26 (x=1, y=8) to 30 (x=10, y=8).
* **Row 9:** Values decrease from 23 (x=1, y=9) to 30 (x=10, y=9).
* **Row 10:** Values decrease from 25 (x=1, y=10) to 23 (x=10, y=10).
### Key Observations
* The "After GRPO" heatmap generally exhibits higher values than the "Before GRPO" heatmap, suggesting that the GRPO process increases the frequency of certain digit combinations.
* The "Before GRPO" heatmap shows a clear negative correlation between the number of 'x' digits and the number of 'y' digits.
* The "After GRPO" heatmap shows a more complex pattern, with higher values along the diagonal (equal numbers of 'x' and 'y' digits) and in the upper-right corner (more 'x' digits than 'y' digits).
* The maximum value shifts from 48 (Before GRPO) to 52 (After GRPO).
* The minimum value remains at 7 in both heatmaps.
### Interpretation
The data suggests that the GRPO process alters the distribution of digits 'x' and 'y'. Before GRPO, there's a tendency for lower counts of both digits to occur together. After GRPO, the process seems to increase the frequency of combinations where the number of 'x' digits is equal to or greater than the number of 'y' digits. This could indicate that GRPO is a process that either generates more 'x' digits, reduces 'y' digits, or preferentially combines them in certain ways.
The increase in values along the diagonal in the "After GRPO" heatmap suggests that the process might be creating more instances where the number of 'x' digits and 'y' digits are equal. The higher values in the upper-right corner suggest an increase in instances where there are more 'x' digits than 'y' digits.
Without knowing what GRPO represents, it's difficult to provide a more specific interpretation. However, the data clearly demonstrates that GRPO has a significant impact on the distribution of these digits. Further investigation into the nature of GRPO is needed to understand the underlying mechanisms driving these changes.