TECHNICAL ASSET FINGERPRINT
36a9871cf684fa24d7a4ac22
Click to view fullscreen
Press ESC or click to close
FOUND IN PAPERS
EXPERT: healer-alpha-free VERSION 1
RUNTIME: free/openrouter/healer-alpha
INTEL_VERIFIED
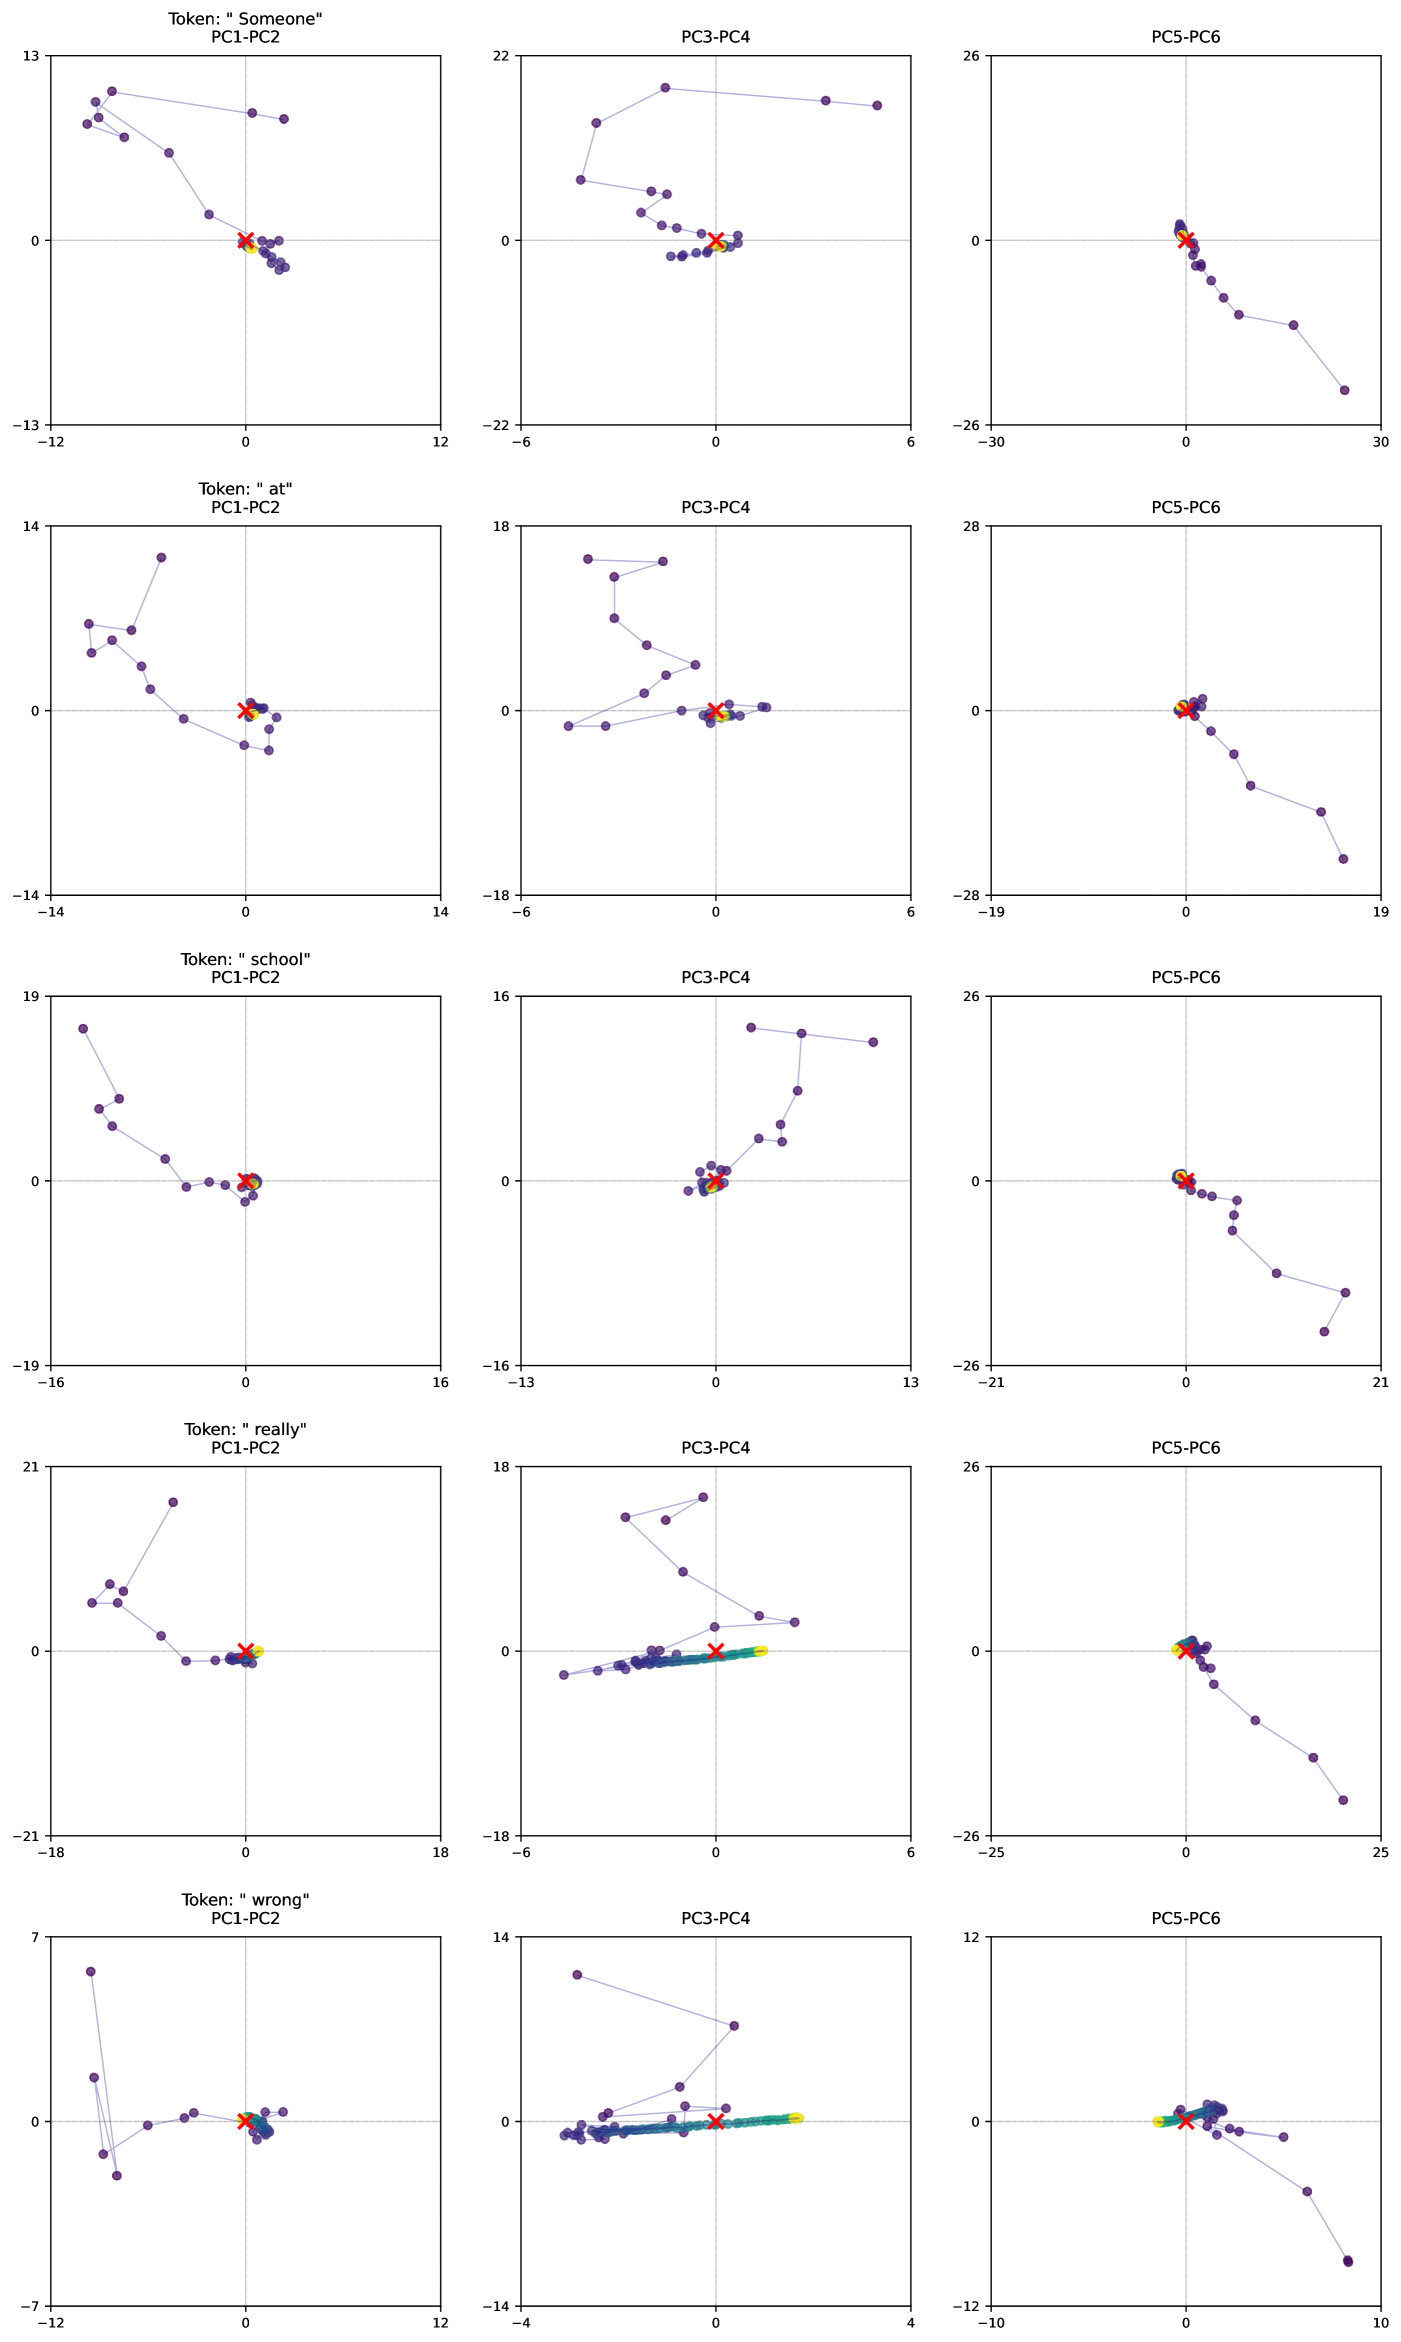
## PCA Projection Grid: Token Embedding Trajectories
### Overview
The image displays a 5x3 grid of scatter plots, visualizing the trajectories of five different text tokens ("Someone", "at", "school", "really", "wrong") across three different pairs of principal components (PC1-PC2, PC3-PC4, PC5-PC6). Each row corresponds to a single token, and each column corresponds to a specific PC pair projection. The plots show a series of connected points (purple dots) forming a path, with a cluster of yellow dots and a red "X" marker at the origin (0,0) of each plot. This visualization likely represents the evolution or variation of token embeddings within a model's latent space, projected onto its principal components.
### Components/Axes
* **Grid Structure:** 5 rows (Tokens) x 3 columns (PC Pairs).
* **Row Titles (Token Labels):**
* Row 1: `Token: "Someone"`
* Row 2: `Token: "at"`
* Row 3: `Token: "school"`
* Row 4: `Token: "really"`
* Row 5: `Token: "wrong"`
* **Column Titles (PC Pair Labels):**
* Column 1: `PC1-PC2`
* Column 2: `PC3-PC4`
* Column 3: `PC5-PC6`
* **Axes:** Each subplot has a horizontal (X) and vertical (Y) axis representing the values of the respective principal components. The scales vary per plot.
* **Legend Elements (Inferred from visual markers):**
* **Purple dots connected by a thin line:** Represent a sequence or trajectory of data points for the given token.
* **Yellow dots:** A dense cluster of points located at or very near the origin (0,0).
* **Red "X" marker:** Explicitly marks the origin (0,0) in each plot.
* **Spatial Grounding:** The legend elements (yellow cluster, red X) are consistently positioned at the center (origin) of each plot. The purple trajectory originates from or passes through this central cluster and extends outward.
### Detailed Analysis
**Row 1: Token "Someone"**
* **PC1-PC2 (Top-Left):** X-axis: -12 to 12, Y-axis: -13 to 13. The purple trajectory starts near the origin, moves left and up to approximately (-10, 10), then curves back down towards the origin, ending near (0, -2).
* **PC3-PC4 (Top-Center):** X-axis: -6 to 6, Y-axis: -22 to 22. The trajectory starts at the origin, moves left and up to (-5, 18), then makes a sharp turn right and down, ending near (5, 18).
* **PC5-PC6 (Top-Right):** X-axis: -30 to 30, Y-axis: -26 to 26. The trajectory starts at the origin and moves predominantly down and to the right, ending near (25, -22).
**Row 2: Token "at"**
* **PC1-PC2:** X-axis: -14 to 14, Y-axis: -14 to 14. Trajectory starts at origin, moves left and up to (-12, 8), then loops back towards the origin.
* **PC3-PC4:** X-axis: -6 to 6, Y-axis: -18 to 18. Trajectory starts at origin, moves left and up to (-5, 16), then moves right and down, ending near (5, 0).
* **PC5-PC6:** X-axis: -19 to 19, Y-axis: -28 to 28. Trajectory starts at origin and moves down and right, ending near (18, -25).
**Row 3: Token "school"**
* **PC1-PC2:** X-axis: -16 to 16, Y-axis: -19 to 19. Trajectory starts at origin, moves left and up to (-14, 16), then curves back down towards the origin.
* **PC3-PC4:** X-axis: -13 to 13, Y-axis: -16 to 16. Trajectory starts at origin, moves right and up to (12, 14), then moves left and down, ending near (-2, 0).
* **PC5-PC6:** X-axis: -21 to 21, Y-axis: -26 to 26. Trajectory starts at origin and moves down and right, ending near (20, -22).
**Row 4: Token "really"**
* **PC1-PC2:** X-axis: -18 to 18, Y-axis: -21 to 21. Trajectory starts at origin, moves left and up to (-16, 18), then curves back down towards the origin.
* **PC3-PC4:** X-axis: -6 to 6, Y-axis: -18 to 18. Trajectory starts at origin, moves left and up to (-5, 16), then moves right and down, ending near (5, 2). A dense horizontal band of points is visible along Y=0 from X=-4 to X=4.
* **PC5-PC6:** X-axis: -25 to 25, Y-axis: -26 to 26. Trajectory starts at origin and moves down and right, ending near (24, -24).
**Row 5: Token "wrong"**
* **PC1-PC2:** X-axis: -12 to 12, Y-axis: -7 to 7. Trajectory starts at origin, moves left and up to (-10, 6), then moves down and right, ending near (2, 0).
* **PC3-PC4:** X-axis: -4 to 4, Y-axis: -14 to 14. Trajectory starts at origin, moves left and up to (-3, 12), then moves right and down, ending near (3, 0). A very dense horizontal band of points is visible along Y=0 from X=-3 to X=3.
* **PC5-PC6:** X-axis: -10 to 10, Y-axis: -12 to 12. Trajectory starts at origin and moves down and right, ending near (9, -11).
### Key Observations
1. **Consistent Trajectory Pattern:** For every token and every PC pair, the purple trajectory originates from the central cluster (yellow dots/red X at origin) and moves outward before often curving back. This suggests a common starting point or reference state.
2. **PC5-PC6 Uniformity:** The plots in the third column (PC5-PC6) show the most consistent trend across all tokens: a nearly linear trajectory moving from the origin into the bottom-right quadrant (positive PC5, negative PC6).
3. **Dense Horizontal Bands:** For tokens "really" and "wrong", the PC3-PC4 plots show an extremely dense horizontal band of points along Y=0, indicating many data points with near-zero PC4 values across a range of PC3 values.
4. **Varying Axis Scales:** The range of values on the axes differs significantly between tokens and PC pairs, indicating that the variance captured by each principal component is token-dependent. For example, "school" in PC1-PC2 spans ~32 units on X, while "wrong" spans ~24 units.
5. **Central Cluster:** The yellow dots are always tightly clustered at the origin, suggesting they represent a baseline, average, or initial embedding state from which the purple trajectories deviate.
### Interpretation
This visualization demonstrates how the internal representations (embeddings) of specific words in a neural network vary across the network's principal dimensions of variation. The purple trajectories likely represent the change in a token's embedding across different layers, attention heads, or contexts within the model.
* **What the data suggests:** The consistent outward movement from the origin implies that as information is processed (e.g., through network layers), token representations become more distinct and specialized, moving away from a generic starting point. The return towards the origin in some plots (e.g., "Someone" PC1-PC2) could indicate a convergence or refinement process.
* **Relationship between elements:** Each row shows the same token's journey through different "views" (PC pairs) of the embedding space. The columns show how different principal components capture different aspects of this variation. The uniformity in PC5-PC6 suggests this component pair captures a fundamental, token-invariant direction of change in the model.
* **Notable anomalies:** The dense horizontal bands for "really" and "wrong" in PC3-PC4 are striking. They indicate that for these tokens, a significant amount of variation is captured almost exclusively along the PC3 axis, with PC4 remaining static. This could point to a specific, dominant feature in the model's processing of these particular words. The difference in trajectory shapes between tokens (e.g., the sharp turn for "Someone" PC3-PC4 vs. the smoother curve for "school" PC1-PC2) highlights that different words engage the model's representational dimensions in unique ways.
DECODING INTELLIGENCE...