TECHNICAL ASSET FINGERPRINT
36ad04a5b6e0bea17f661eae
Click to view fullscreen
Press ESC or click to close
FOUND IN PAPERS
EXPERT: gemini-2.0-flash VERSION 1
RUNTIME: nugit/gemini/gemini-2.0-flash
INTEL_VERIFIED
## Chart/Diagram Type: Multi-Panel Performance Comparison
### Overview
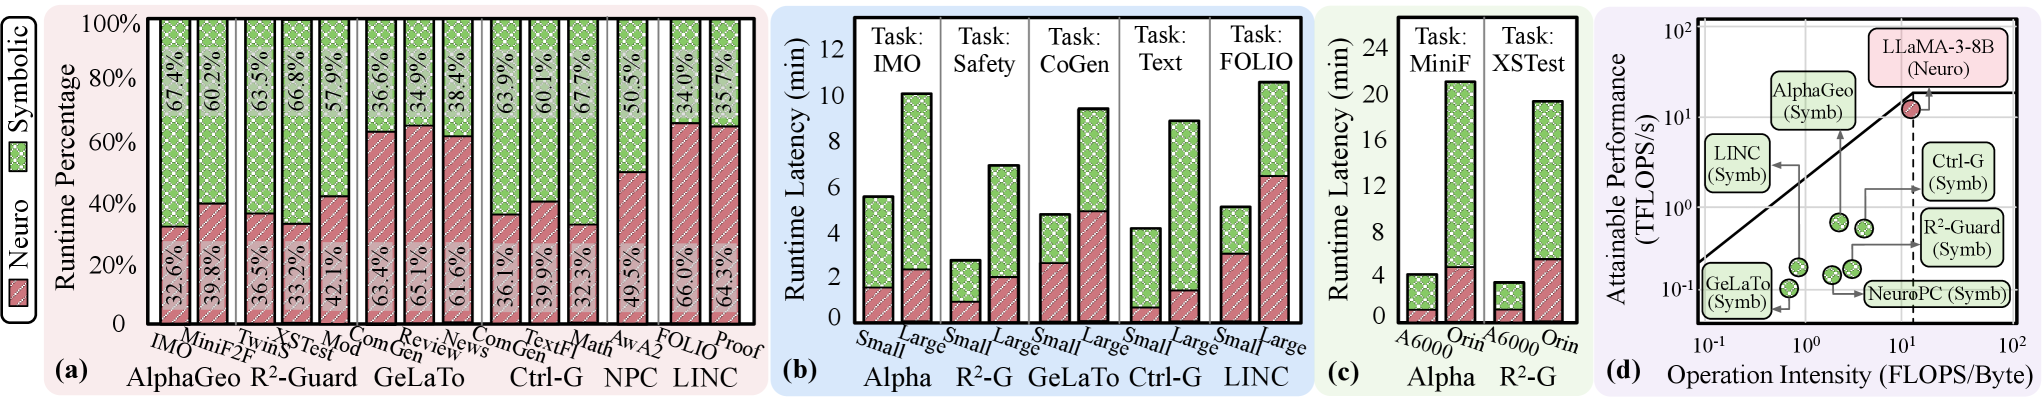
The image presents a multi-panel figure comparing the performance of different systems (AlphaGeo, R2-Guard, GeLaTo, Ctrl-G, NPC, LINC, LLaMA-3-8B, and NeuroPC) across various tasks and hardware configurations. The figure consists of four subplots: (a) Runtime percentage breakdown between Neuro and Symbolic components, (b) Runtime latency for different tasks with "Small" and "Large" configurations, (c) Runtime latency on different hardware (A6000 and Orin), and (d) Attainable performance versus operation intensity.
### Components/Axes
**Panel (a): Stacked Bar Chart - Runtime Percentage**
* **Title:** None explicitly given, but implied as "Runtime Percentage"
* **Y-axis:** Runtime Percentage, ranging from 0% to 100%.
* **X-axis:** Different systems: AlphaGeo, R2-Guard, GeLaTo, Ctrl-G, NPC, LINC. Each system is evaluated on different tasks such as IMO, MiniF2F, Twins, XSTest, Method, ComGen, ReviewGen, News, ComGen, TextF, Math, AwA2, FOLIO, Proof.
* **Legend (top-right):**
* Red (slanted lines): Neuro
* Green (dotted): Symbolic
**Panel (b): Grouped Bar Chart - Runtime Latency (min)**
* **Title:** None explicitly given, but implied as "Runtime Latency (min)"
* **Y-axis:** Runtime Latency (min), ranging from 0 to 12.
* **X-axis:** Different systems: Alpha, R2-G, GeLaTo, Ctrl-G, LINC. Each system is evaluated on "Small" and "Large" configurations.
* **Tasks (top):** IMO, Safety, CoGen, Text, FOLIO
* **Legend:**
* Red (slanted lines): Lower portion of the bar
* Green (dotted): Upper portion of the bar
**Panel (c): Grouped Bar Chart - Runtime Latency (min)**
* **Title:** None explicitly given, but implied as "Runtime Latency (min)"
* **Y-axis:** Runtime Latency (min), ranging from 0 to 24.
* **X-axis:** Different systems: Alpha, R2-G. Each system is evaluated on A6000 and Orin hardware.
* **Tasks (top):** MiniF, XSTest
* **Legend:**
* Red (slanted lines): Lower portion of the bar
* Green (dotted): Upper portion of the bar
**Panel (d): Scatter Plot - Attainable Performance vs. Operation Intensity**
* **Y-axis:** Attainable Performance (TFLOPS/s), logarithmic scale from 10<sup>-1</sup> to 10<sup>2</sup>.
* **X-axis:** Operation Intensity (FLOPS/Byte), logarithmic scale from 10<sup>-1</sup> to 10<sup>2</sup>.
* **Data Points:**
* AlphaGeo (Symb)
* LINC (Symb)
* Ctrl-G (Symb)
* R2-Guard (Symb)
* GeLaTo (Symb)
* NeuroPC (Symb)
* LLaMA-3-8B (Neuro)
### Detailed Analysis
**Panel (a): Runtime Percentage**
* **AlphaGeo:** Neuro runtime ranges from approximately 32.6% (IMO) to 65.1% (ReviewGen). Symbolic runtime ranges from 67.4% (IMO) to 34.9% (ReviewGen).
* **R2-Guard:** Neuro runtime ranges from approximately 39.8% (MiniF2F) to 36.1% (ComGen). Symbolic runtime ranges from 60.2% (MiniF2F) to 63.9% (ComGen).
* **GeLaTo:** Neuro runtime ranges from approximately 36.5% (Twins) to 39.9% (TextF). Symbolic runtime ranges from 63.5% (Twins) to 60.1% (TextF).
* **Ctrl-G:** Neuro runtime ranges from approximately 33.2% (XSTest) to 32.3% (Math). Symbolic runtime ranges from 66.8% (XSTest) to 67.7% (Math).
* **NPC:** Neuro runtime ranges from approximately 42.1% (Method) to 49.5% (AwA2). Symbolic runtime ranges from 57.9% (Method) to 50.5% (AwA2).
* **LINC:** Neuro runtime ranges from approximately 63.4% (ComGen) to 66.0% (FOLIO) to 64.3% (Proof). Symbolic runtime ranges from 36.6% (ComGen) to 34.0% (FOLIO) to 35.7% (Proof).
**Panel (b): Runtime Latency (min)**
* **Alpha:** Small configuration has a Neuro runtime of approximately 1.5 min and a Symbolic runtime of approximately 3.5 min. Large configuration has a Neuro runtime of approximately 2.2 min and a Symbolic runtime of approximately 4.8 min.
* **R2-G:** Small configuration has a Neuro runtime of approximately 0.5 min and a Symbolic runtime of approximately 2.5 min. Large configuration has a Neuro runtime of approximately 2.0 min and a Symbolic runtime of approximately 4.0 min.
* **GeLaTo:** Small configuration has a Neuro runtime of approximately 2.0 min and a Symbolic runtime of approximately 3.0 min. Large configuration has a Neuro runtime of approximately 4.5 min and a Symbolic runtime of approximately 3.5 min.
* **Ctrl-G:** Small configuration has a Neuro runtime of approximately 0.5 min and a Symbolic runtime of approximately 2.5 min. Large configuration has a Neuro runtime of approximately 1.5 min and a Symbolic runtime of approximately 5.5 min.
* **LINC:** Small configuration has a Neuro runtime of approximately 1.0 min and a Symbolic runtime of approximately 4.0 min. Large configuration has a Neuro runtime of approximately 2.5 min and a Symbolic runtime of approximately 7.5 min.
**Panel (c): Runtime Latency (min)**
* **Alpha:** A6000 has a Neuro runtime of approximately 1.0 min and a Symbolic runtime of approximately 3.0 min. Orin has a Neuro runtime of approximately 2.0 min and a Symbolic runtime of approximately 4.0 min.
* **R2-G:** A6000 has a Neuro runtime of approximately 0.5 min and a Symbolic runtime of approximately 2.5 min. Orin has a Neuro runtime of approximately 1.0 min and a Symbolic runtime of approximately 3.0 min.
**Panel (d): Attainable Performance vs. Operation Intensity**
* **LLaMA-3-8B (Neuro):** Located at approximately (1, 40) on the log-log scale.
* **AlphaGeo (Symb):** Located at approximately (0.2, 2).
* **LINC (Symb):** Located at approximately (0.1, 0.8).
* **Ctrl-G (Symb):** Located at approximately (10, 1).
* **R2-Guard (Symb):** Located at approximately (10, 2).
* **GeLaTo (Symb):** Located at approximately (0.1, 0.2).
* **NeuroPC (Symb):** Located at approximately (10, 0.1).
### Key Observations
* Panel (a) shows the percentage of runtime attributed to Neuro and Symbolic components across different systems and tasks. The Symbolic component generally dominates the runtime.
* Panel (b) shows that the "Large" configuration generally increases the runtime latency compared to the "Small" configuration.
* Panel (c) shows that the Orin hardware generally results in higher runtime latency compared to the A6000 hardware.
* Panel (d) shows the relationship between attainable performance and operation intensity for different systems. LLaMA-3-8B (Neuro) has a relatively high attainable performance, while NeuroPC (Symb) has a relatively low attainable performance.
### Interpretation
The data suggests that the Symbolic component often contributes more to the overall runtime than the Neuro component across various tasks and systems. The "Large" configurations in Panel (b) likely represent larger problem sizes or more complex scenarios, leading to increased runtime latency. The hardware comparison in Panel (c) indicates that the Orin hardware, despite potentially being more powerful, does not always translate to lower runtime latency, possibly due to overhead or optimization issues. The scatter plot in Panel (d) provides insights into the performance characteristics of different systems, with LLaMA-3-8B (Neuro) demonstrating a higher attainable performance compared to other systems. The placement of the systems on the plot indicates their suitability for different types of workloads based on their operation intensity and attainable performance.
DECODING INTELLIGENCE...