## Diagram: Set Relationships
### Overview
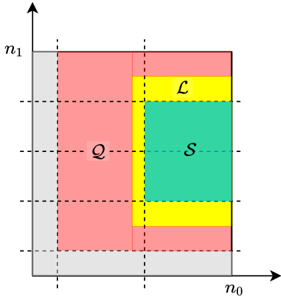
The image is a diagram illustrating the relationships between three sets: Q, L, and S, within a larger space defined by axes n0 and n1. The diagram uses color-coding to distinguish the sets and their intersections.
### Components/Axes
* **Axes:**
* Horizontal axis: n0
* Vertical axis: n1
* **Sets:**
* Q: Represented by a red area.
* L: Represented by a yellow area.
* S: Represented by a green area.
* **Background:** A gray area represents the space outside the sets.
### Detailed Analysis
* **Set Q (Red):** Occupies a significant portion of the left side of the diagram.
* **Set L (Yellow):** Forms a vertical band on the right side of set Q and above and below set S.
* **Set S (Green):** Located in the intersection of sets Q and L.
* **Intersections:**
* The intersection of Q and L is partially occupied by S.
* The intersection of L and S is the set S.
* **Spatial Relationships:**
* Q is primarily on the left.
* L is primarily on the right.
* S is contained within the intersection of Q and L.
### Key Observations
* The diagram visually represents set inclusion and intersection.
* Set S is a subset of both Q and L.
* The sets are arranged in a way that highlights their overlapping regions.
### Interpretation
The diagram illustrates the relationships between three sets, Q, L, and S, where S is a subset of both Q and L. This type of diagram is commonly used in set theory and logic to visually represent relationships between different groups or categories. The spatial arrangement and color-coding make it easy to understand the inclusion and intersection of these sets. The diagram suggests that elements in set S possess characteristics of both sets Q and L.