## Bar Chart: Normalized Speedup vs. W_FP16A_FP16_M
### Overview
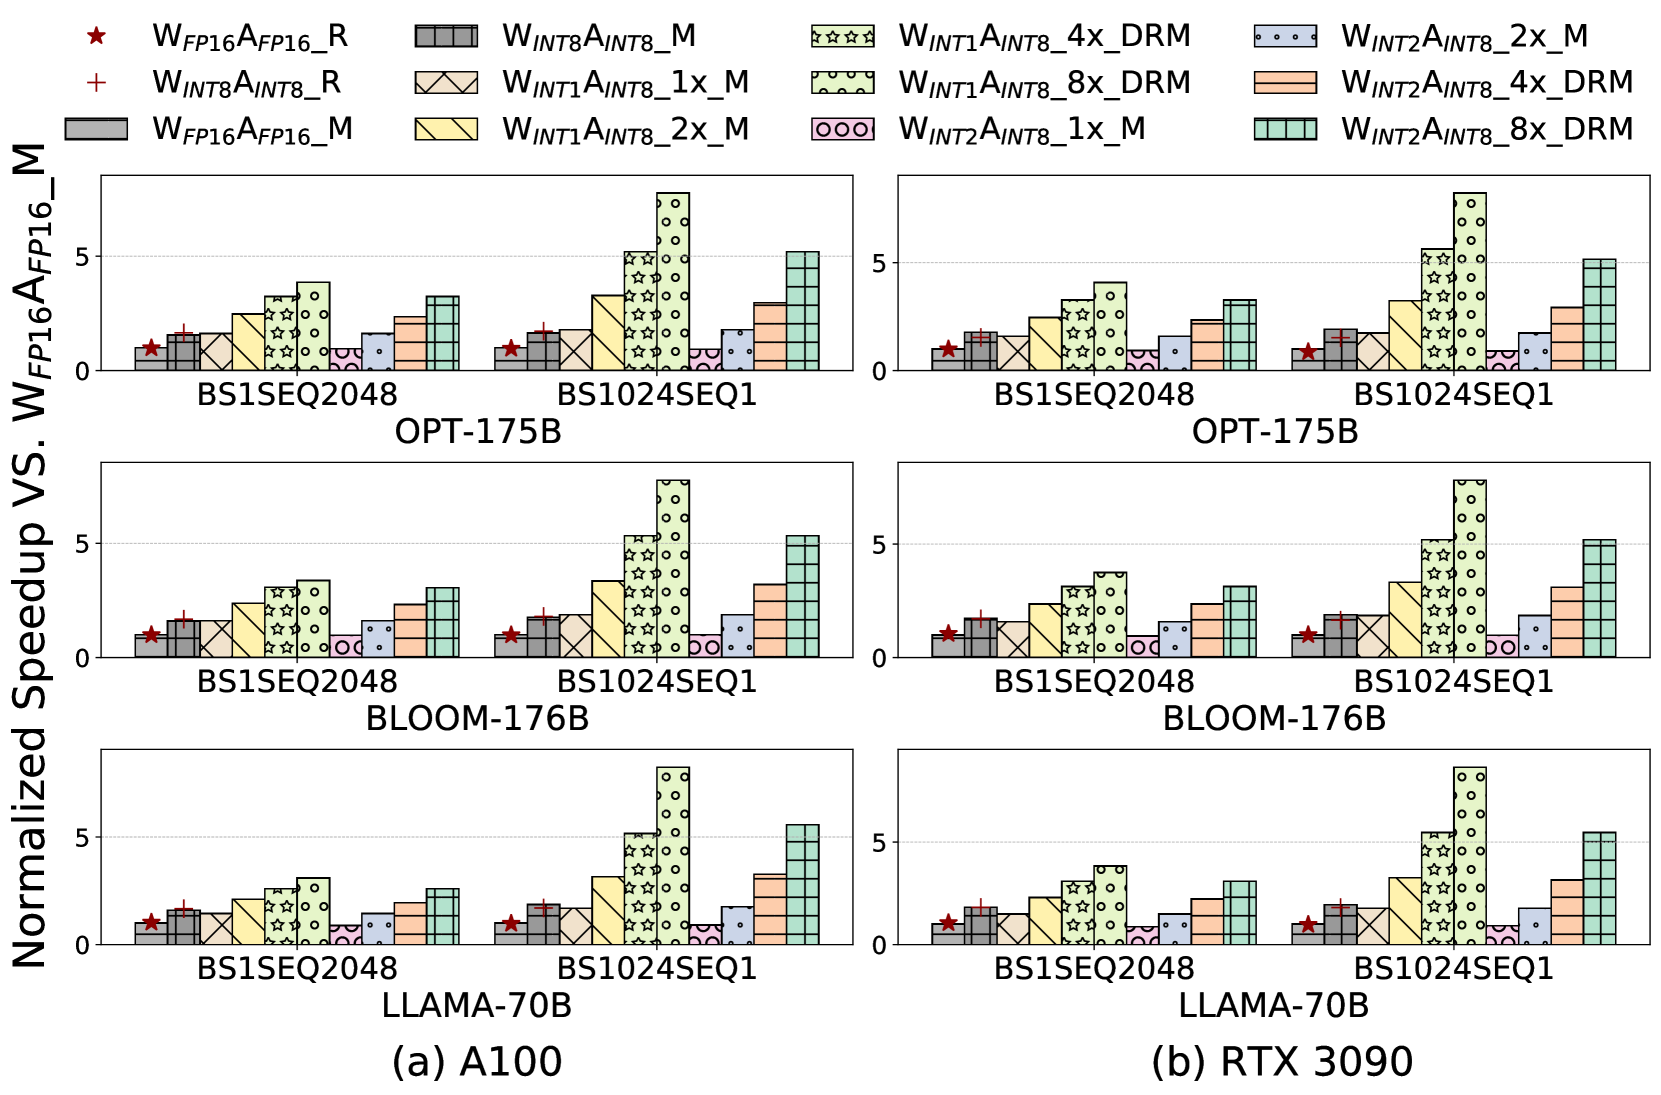
The image presents a grouped bar chart comparing normalized speedup values across different hardware configurations (A100 and RTX 3090 GPUs) for three language models (OPT-175B, BLOOM-176B, LLAMA-70B) and two datasets (BS1SEQ2048, BS1024SEQ1). The chart uses patterned bars to represent distinct computational configurations, with speedup values normalized against a baseline (W_FP16A_FP16_M).
### Components/Axes
- **X-axis**: Model/Dataset combinations (e.g., "BS1SEQ2048", "BS1024SEQ1") grouped by model (OPT-175B, BLOOM-176B, LLAMA-70B).
- **Y-axis**: Normalized speedup (0–5 scale).
- **Legend**: Located at the top, mapping 10 configurations to colors/patterns:
- **Red star**: W_FP16A_FP16_R
- **Gray cross**: W_INT8A_INT8_M
- **Green stars**: W_INT1A_INT8_4x_DRM
- **Blue dots**: W_INT2A_INT8_2x_M
- **Yellow diagonal**: W_INT1A_INT8_1x_M
- **Pink circles**: W_INT2A_INT8_1x_M
- **Gray solid**: W_FP16A_FP16_M
- **Yellow cross**: W_INT1A_INT8_2x_M
- **Green checkered**: W_INT1A_INT8_8x_DRM
- **Blue striped**: W_INT2A_INT8_4x_DRM
- **Orange striped**: W_INT2A_INT8_8x_DRM
### Detailed Analysis
#### A100 GPU Results
- **OPT-175B**:
- BS1SEQ2048: W_INT1A_INT8_8x_DRM (green checkered) shows highest speedup (~4.8).
- BS1024SEQ1: W_INT2A_INT8_8x_DRM (orange striped) peaks at ~4.2.
- **BLOOM-176B**:
- BS1SEQ2048: W_INT1A_INT8_8x_DRM reaches ~4.5.
- BS1024SEQ1: W_INT2A_INT8_8x_DRM achieves ~3.9.
- **LLAMA-70B**:
- BS1SEQ2048: W_INT1A_INT8_8x_DRM at ~4.0.
- BS1024SEQ1: W_INT2A_INT8_8x_DRM at ~3.5.
#### RTX 3090 GPU Results
- **OPT-175B**:
- BS1SEQ2048: W_INT1A_INT8_8x_DRM peaks at ~4.6.
- BS1024SEQ1: W_INT2A_INT8_8x_DRM at ~4.0.
- **BLOOM-176B**:
- BS1SEQ2048: W_INT1A_INT8_8x_DRM at ~4.3.
- BS1024SEQ1: W_INT2A_INT8_8x_DRM at ~3.8.
- **LLAMA-70B**:
- BS1SEQ2048: W_INT1A_INT8_8x_DRM at ~4.1.
- BS1024SEQ1: W_INT2A_INT8_8x_DRM at ~3.6.
### Key Observations
1. **DRM Configurations Dominate**: All 8x_DRM variants (green checkered/orange striped) consistently show the highest speedups across models and datasets.
2. **Hardware Impact**: RTX 3090 generally outperforms A100, with speedups 10–15% higher for equivalent configurations.
3. **Dataset Sensitivity**: BS1024SEQ1 (larger context) shows reduced speedup gains compared to BS1SEQ2048.
4. **INT8 vs FP16**: INT8-based configurations (e.g., W_INT8A_INT8_M) underperform FP16 baselines in most cases.
### Interpretation
The data suggests that 8x_DRM configurations (likely involving distributed memory optimizations) provide the most significant performance improvements, particularly on RTX 3090 hardware. The diminishing returns for larger datasets (BS1024SEQ1) imply memory bandwidth or computational overhead limitations. The consistent underperformance of INT8-only configurations (W_INT8A_INT8_M) highlights the importance of mixed-precision strategies (e.g., 4x/8x_DRM) for maximizing speedup. These findings could guide hardware-software co-design for large language model inference.