## Line Graphs: LongBench Accuracy vs KV Cache Size for Qasper and GovReport Datasets
### Overview
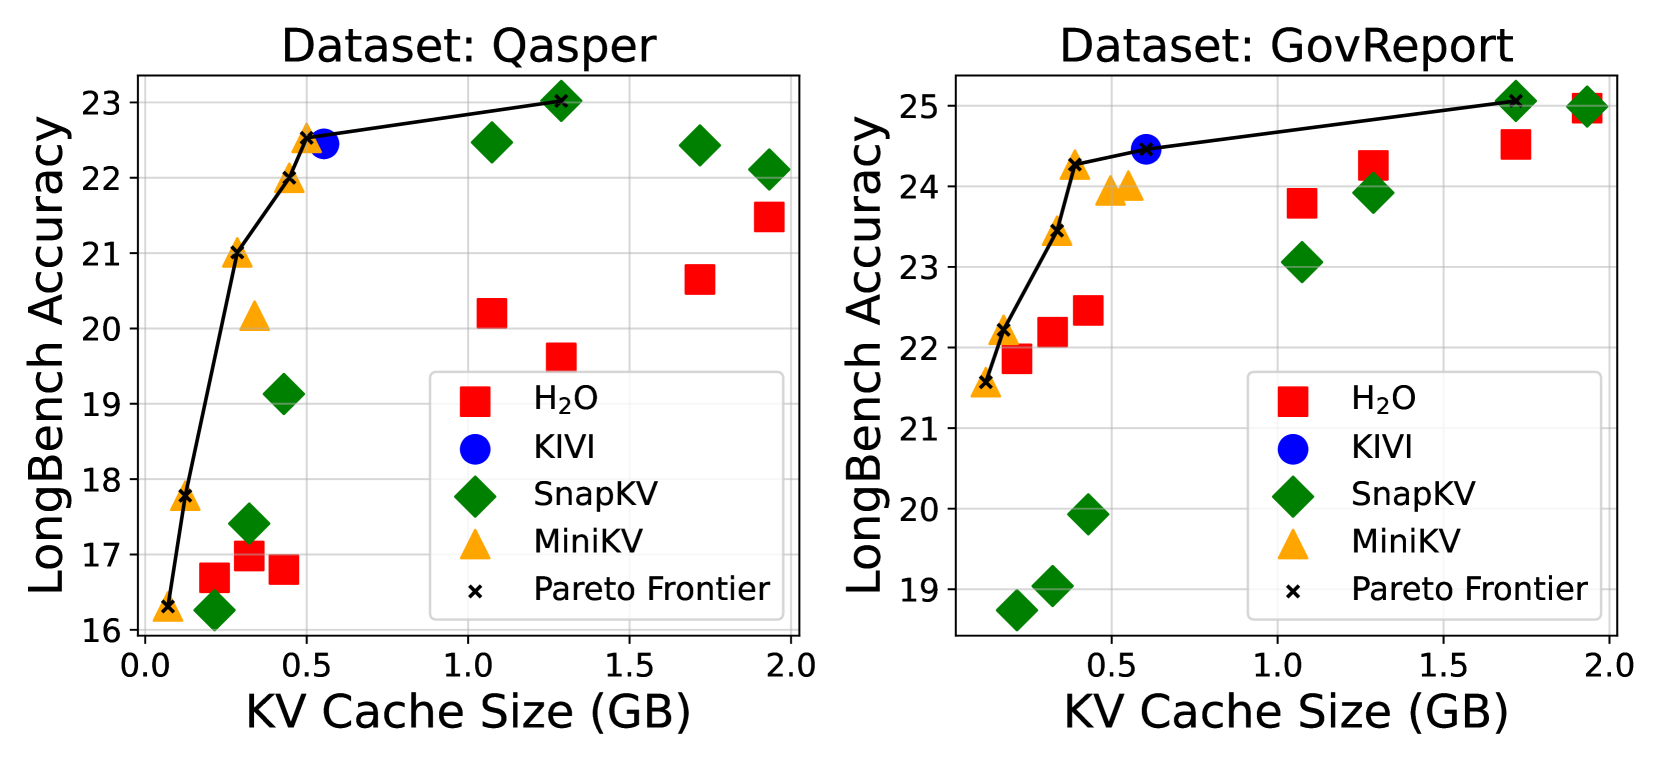
Two side-by-side line graphs compare LongBench Accuracy against KV Cache Size (GB) for four models (H₂O, KIVI, SnapKV, MiniKV) across two datasets (Qasper and GovReport). The Pareto Frontier (black crosses) represents optimal trade-offs between cache size and accuracy.
### Components/Axes
- **X-axis**: KV Cache Size (GB) ranging from 0.0 to 2.0 GB in 0.5 GB increments.
- **Y-axis**: LongBench Accuracy (Qasper: 16–23, GovReport: 19–25).
- **Legend**:
- Red squares: H₂O
- Blue circle: KIVI
- Green diamonds: SnapKV
- Yellow triangles: MiniKV
- Black crosses: Pareto Frontier
### Detailed Analysis
#### Dataset: Qasper
- **Pareto Frontier**: Starts at ~16.5 accuracy (0.0 GB) and rises to ~23.0 accuracy (1.5 GB).
- **Model Data Points**:
- H₂O (red squares): Peaks at ~21.5 accuracy (1.5 GB), with lower values at smaller cache sizes.
- KIVI (blue circle): Highest accuracy (~22.5) at 0.75 GB, then declines.
- SnapKV (green diamonds): Consistent ~22 accuracy across 0.5–2.0 GB.
- MiniKV (yellow triangles): Lowest accuracy (~17–20) across all cache sizes.
#### Dataset: GovReport
- **Pareto Frontier**: Starts at ~21.5 accuracy (0.0 GB) and rises to ~25.0 accuracy (1.5 GB).
- **Model Data Points**:
- H₂O (red squares): Peaks at ~24.5 accuracy (1.5 GB), with moderate values at smaller cache sizes.
- KIVI (blue circle): Highest accuracy (~24.5) at 0.75 GB, then declines.
- SnapKV (green diamonds): Consistent ~23.5 accuracy across 0.5–2.0 GB.
- MiniKV (yellow triangles): Lowest accuracy (~21–23) across all cache sizes.
### Key Observations
1. **Pareto Frontier Dominance**: Both datasets show the Pareto Frontier as the optimal trajectory, with models clustering near or below it.
2. **Cache Size Impact**: Accuracy generally increases with cache size, but diminishing returns are evident (e.g., KIVI’s drop after 0.75 GB).
3. **Model Performance**:
- **H₂O** and **SnapKV** perform best in GovReport, while **KIVI** excels in Qasper.
- **MiniKV** consistently underperforms across both datasets.
4. **Outliers**: MiniKV’s low accuracy at 0.0 GB (Qasper: ~16.5, GovReport: ~19) suggests inefficiency at small cache sizes.
### Interpretation
The data demonstrates a clear trade-off between KV cache size and LongBench Accuracy, with the Pareto Frontier highlighting the most efficient models. Larger cache sizes improve performance, but models like MiniKV lag behind, indicating potential architectural limitations. The divergence in model performance between datasets suggests dataset-specific optimizations may be necessary. Notably, KIVI’s peak at 0.75 GB in Qasper and H₂O’s dominance in GovReport imply that model architecture and dataset characteristics interact to determine optimal cache utilization.