TECHNICAL ASSET FINGERPRINT
3727160a74afcdf974a3385b
Click to view fullscreen
Press ESC or click to close
FOUND IN PAPERS
EXPERT: gemma-3-27b-it-free VERSION 1
RUNTIME: google-free/gemma-3-27b-it
INTEL_VERIFIED
\n
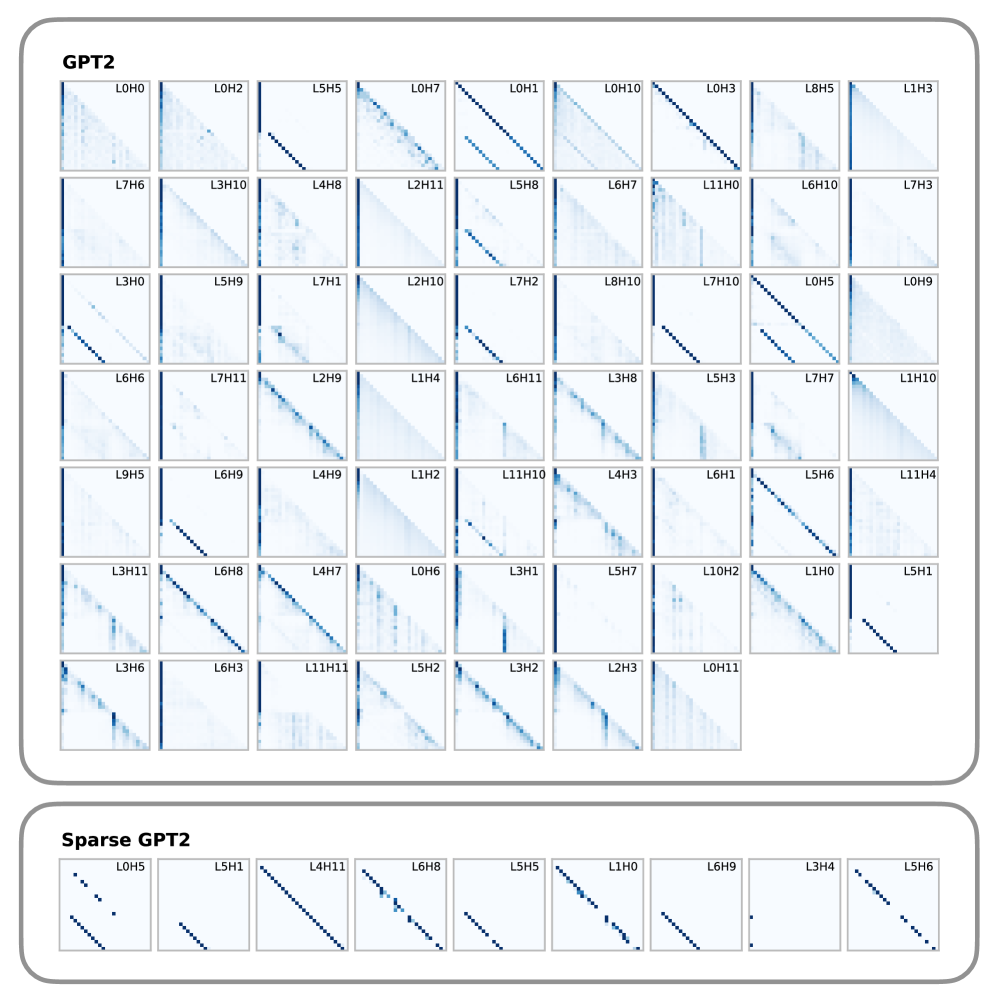
## Scatter Plot Matrix: GPT2 and Sparse GPT2 Attention Heads
### Overview
The image presents a scatter plot matrix comparing attention heads between two models: GPT2 and Sparse GPT2. Each cell in the matrix displays a scatter plot visualizing the relationship between two attention heads. The matrix is organized into a grid, with each row and column representing an attention head. The top section of the matrix represents GPT2 attention heads, and the bottom section represents Sparse GPT2 attention heads.
### Components/Axes
The matrix is composed of 6 rows and 6 columns, resulting in 36 individual scatter plots. Each scatter plot has two axes, both labeled implicitly by the corresponding attention head identifier. The attention head identifiers follow the format "L[layer number]H[head number]". The layer numbers range from 0 to 11, and the head numbers range from 0 to 11. The top section is labeled "GPT2" and the bottom section is labeled "Sparse GPT2".
### Detailed Analysis or Content Details
The matrix can be divided into two main sections: GPT2 (top) and Sparse GPT2 (bottom). Each cell contains a scatter plot. The plots show the relationship between two attention heads. The x and y axes of each plot represent the values of the attention weights for the corresponding heads.
**GPT2 Section (Top 6 rows):**
* **L0H0 vs. L0H2:** A very sparse scatter plot with points clustered near the origin.
* **L0H0 vs. L5H5:** A very sparse scatter plot with points clustered near the origin.
* **L0H0 vs. L0H7:** A very sparse scatter plot with points clustered near the origin.
* **L0H0 vs. L0H1:** A very sparse scatter plot with points clustered near the origin.
* **L0H0 vs. L0H10:** A very sparse scatter plot with points clustered near the origin.
* **L0H0 vs. L0H3:** A very sparse scatter plot with points clustered near the origin.
* **L0H0 vs. L8H5:** A very sparse scatter plot with points clustered near the origin.
* **L0H0 vs. L1H3:** A very sparse scatter plot with points clustered near the origin.
* **L7H6 vs. L3H10:** A very sparse scatter plot with points clustered near the origin.
* **L7H6 vs. L4H8:** A very sparse scatter plot with points clustered near the origin.
* **L7H6 vs. L2H11:** A very sparse scatter plot with points clustered near the origin.
* **L7H6 vs. L5H8:** A very sparse scatter plot with points clustered near the origin.
* **L7H6 vs. L6H7:** A very sparse scatter plot with points clustered near the origin.
* **L7H6 vs. L1H10:** A very sparse scatter plot with points clustered near the origin.
* **L7H6 vs. L6H10:** A very sparse scatter plot with points clustered near the origin.
* **L7H3 vs. L3H0:** A very sparse scatter plot with points clustered near the origin.
* **L3H0 vs. L5H9:** A very sparse scatter plot with points clustered near the origin.
* **L3H0 vs. L7H1:** A very sparse scatter plot with points clustered near the origin.
* **L3H0 vs. L2H10:** A very sparse scatter plot with points clustered near the origin.
* **L3H0 vs. L7H2:** A very sparse scatter plot with points clustered near the origin.
* **L3H0 vs. L8H10:** A very sparse scatter plot with points clustered near the origin.
* **L3H0 vs. L7H10:** A very sparse scatter plot with points clustered near the origin.
* **L3H0 vs. L9H5:** A very sparse scatter plot with points clustered near the origin.
* **L6H6 vs. L7H11:** A very sparse scatter plot with points clustered near the origin.
* **L6H6 vs. L2H9:** A very sparse scatter plot with points clustered near the origin.
* **L6H6 vs. L1H4:** A very sparse scatter plot with points clustered near the origin.
* **L6H6 vs. L6H11:** A very sparse scatter plot with points clustered near the origin.
* **L6H6 vs. L3H8:** A very sparse scatter plot with points clustered near the origin.
* **L6H6 vs. L5H3:** A very sparse scatter plot with points clustered near the origin.
* **L6H6 vs. L7H7:** A very sparse scatter plot with points clustered near the origin.
* **L6H6 vs. L11H10:** A very sparse scatter plot with points clustered near the origin.
* **L9H5 vs. L6H9:** A very sparse scatter plot with points clustered near the origin.
* **L9H5 vs. L4H9:** A very sparse scatter plot with points clustered near the origin.
* **L9H5 vs. L1H2:** A very sparse scatter plot with points clustered near the origin.
* **L9H5 vs. L11H10:** A very sparse scatter plot with points clustered near the origin.
* **L9H5 vs. L4H3:** A very sparse scatter plot with points clustered near the origin.
* **L3H11 vs. L6H8:** A very sparse scatter plot with points clustered near the origin.
* **L3H11 vs. L4H7:** A very sparse scatter plot with points clustered near the origin.
* **L3H11 vs. L0H6:** A very sparse scatter plot with points clustered near the origin.
* **L3H11 vs. L3H1:** A very sparse scatter plot with points clustered near the origin.
* **L3H11 vs. L5H7:** A very sparse scatter plot with points clustered near the origin.
* **L3H11 vs. L10H2:** A very sparse scatter plot with points clustered near the origin.
* **L3H6 vs. L6H3:** A very sparse scatter plot with points clustered near the origin.
* **L3H6 vs. L11H11:** A very sparse scatter plot with points clustered near the origin.
* **L3H6 vs. L5H2:** A very sparse scatter plot with points clustered near the origin.
* **L3H6 vs. L2H3:** A very sparse scatter plot with points clustered near the origin.
* **L3H6 vs. L0H11:** A very sparse scatter plot with points clustered near the origin.
**Sparse GPT2 Section (Bottom 6 rows):**
* **L0H5 vs. L5H1:** A very sparse scatter plot with points clustered near the origin.
* **L0H5 vs. L4H11:** A very sparse scatter plot with points clustered near the origin.
* **L0H5 vs. L6H8:** A very sparse scatter plot with points clustered near the origin.
* **L0H5 vs. L5H5:** A very sparse scatter plot with points clustered near the origin.
* **L0H5 vs. L1H0:** A very sparse scatter plot with points clustered near the origin.
* **L0H5 vs. L6H9:** A very sparse scatter plot with points clustered near the origin.
* **L0H5 vs. L3H4:** A very sparse scatter plot with points clustered near the origin.
* **L0H5 vs. L5H6:** A very sparse scatter plot with points clustered near the origin.
In general, the scatter plots are very sparse, indicating a weak or non-linear relationship between most attention heads.
### Key Observations
The most striking observation is the sparsity of the scatter plots. Almost all plots show very few data points, and those points are clustered near the origin. This suggests that the attention weights of most head pairs are largely independent. There are no obvious clusters or trends in any of the plots.
### Interpretation
The scatter plot matrix is designed to visualize the relationships between attention heads in two different models. The sparsity of the plots suggests that the attention heads in both GPT2 and Sparse GPT2 operate largely independently of each other. This could indicate that the models are utilizing a diverse set of attention mechanisms, with each head focusing on different aspects of the input data. The lack of strong correlations between heads might also suggest that the models are not relying heavily on complex interactions between attention heads. The fact that the patterns are similar in both GPT2 and Sparse GPT2 suggests that the sparsity is not an artifact of the sparse model architecture, but rather a fundamental characteristic of the attention mechanism itself. The data does not provide information about the *strength* of the relationships, only their *presence* or *absence*. The plots are primarily diagnostic, indicating a lack of strong dependencies.
DECODING INTELLIGENCE...