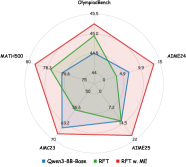
## Radar Chart: Olympicbench Performance Comparison
### Overview
The image is a radar chart comparing the performance of four AI models across five evaluation metrics: Olympialbench, MATH500, AIM24, AIM23, and AIM25. The chart uses four distinct data series (colored lines) to represent different model configurations, with values plotted on a circular scale from 0 to 80.
### Components/Axes
- **Axes (Metrics):**
- Olympialbench (top)
- MATH500 (left)
- AIM24 (right)
- AIM23 (bottom-left)
- AIM25 (bottom-right)
- **Legend (Data Series):**
- **Blue**: Qwen3-8B-Base
- **Green**: RPT
- **Purple**: RPT w/ ME
- **Red**: ADIME24
- **Scale:** Radial axis from 0 to 80, with tick marks at 10-unit intervals.
### Detailed Analysis
- **Olympialbench (Top Axis):**
- ADIME24 (red): 45.5
- RPT (green): 44.5
- Qwen3-8B-Base (blue): 44.5
- RPT w/ ME (purple): 44.5
- **MATH500 (Left Axis):**
- ADIME24 (red): 80
- Qwen3-8B-Base (blue): 78.3
- RPT (green): 75
- RPT w/ ME (purple): 75
- **AIM24 (Right Axis):**
- ADIME24 (red): 15
- Qwen3-8B-Base (blue): 15
- RPT (green): 15
- RPT w/ ME (purple): 15
- **AIM23 (Bottom-Left Axis):**
- ADIME24 (red): 70
- Qwen3-8B-Base (blue): 63.2
- RPT (green): 66.6
- RPT w/ ME (purple): 72
- **AIM25 (Bottom-Right Axis):**
- ADIME24 (red): 22
- Qwen3-8B-Base (blue): 74.5
- RPT (green): 74.5
- RPT w/ ME (purple): 74.5
### Key Observations
1. **ADIME24 (Red)** dominates the Olympialbench and MATH500 metrics, achieving the highest scores (45.5 and 80, respectively).
2. **Qwen3-8B-Base (Blue)** underperforms on Olympialbench (44.5) but matches ADIME24 on AIM25 (74.5).
3. **RPT (Green)** and **RPT w/ ME (Purple)** show near-identical performance across all metrics, with RPT w/ ME slightly outperforming RPT on AIM23 (72 vs. 66.6).
4. **AIM24** is the weakest metric for all models, with scores capped at 15.
### Interpretation
The chart highlights ADIME24 as the top-performing model overall, particularly excelling in Olympialbench and MATH500. Qwen3-8B-Base and RPT/RPT w/ ME show comparable performance in most metrics, though RPT w/ ME gains a marginal edge on AIM23. The uniform low scores on AIM24 suggest this metric may be less discriminative or represent a specialized task. The near-identical AIM25 scores across models imply this metric may not effectively differentiate between configurations. The chart underscores the importance of metric selection in evaluating AI systems, as performance disparities vary significantly by evaluation focus.