## Line Graphs: SciQ and SC@k Performance Comparison
### Overview
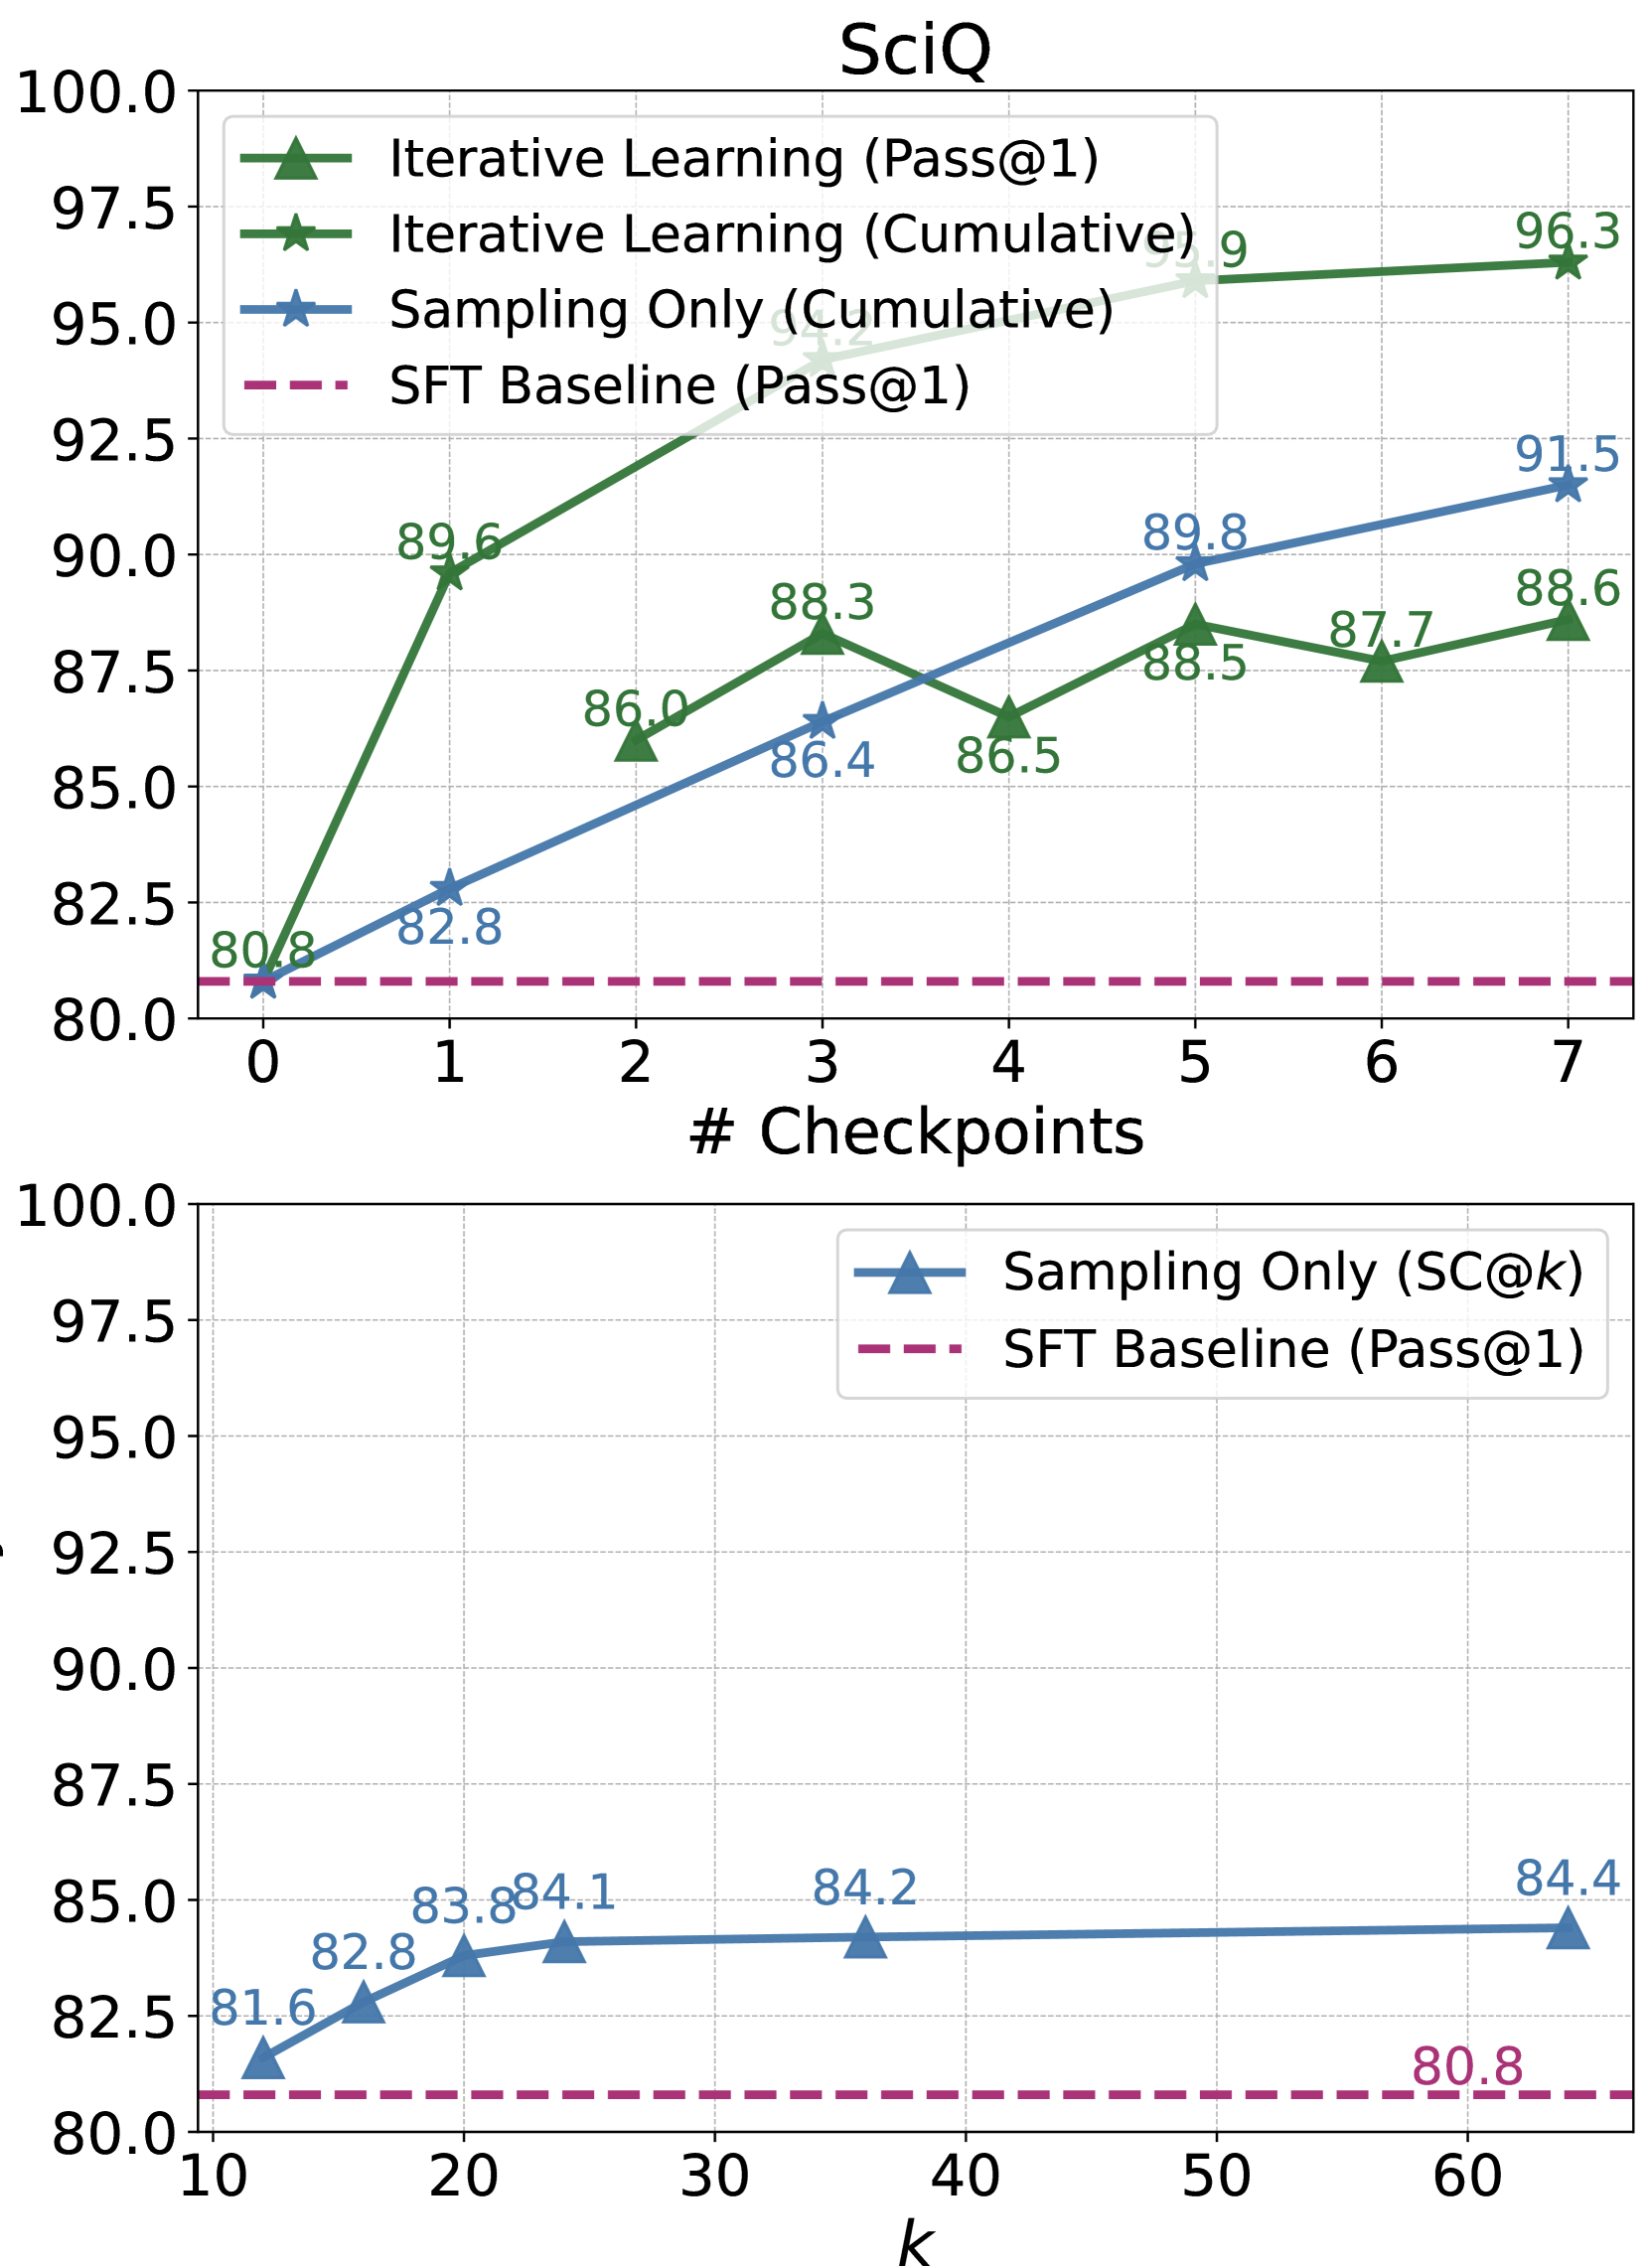
The image contains two line graphs comparing performance metrics across different training methods. The top graph ("SciQ") tracks performance against the number of checkpoints, while the bottom graph ("SC@k") evaluates performance against the number of samples (k). Both graphs use percentage scores on the y-axis and numerical values on the x-axis.
---
### Components/Axes
#### SciQ Graph
- **X-axis**: "# Checkpoints" (0–7, integer increments)
- **Y-axis**: Percentage (%) (80–100, 2.5% increments)
- **Legend**:
- Green triangles: Iterative Learning (Pass@1)
- Green stars: Iterative Learning (Cumulative)
- Blue stars: Sampling Only (Cumulative)
- Dashed purple line: SFT Baseline (Pass@1)
- **Legend Position**: Top-left corner
#### SC@k Graph
- **X-axis**: "k" (10–60, integer increments)
- **Y-axis**: Percentage (%) (80–100, 2.5% increments)
- **Legend**:
- Blue triangles: Sampling Only (SC@k)
- Dashed purple line: SFT Baseline (Pass@1)
- **Legend Position**: Top-right corner
---
### Detailed Analysis
#### SciQ Graph
- **Iterative Learning (Pass@1)**:
- Starts at 80.8% (checkpoint 0) and rises to 96.3% (checkpoint 7).
- Key values: 89.6% (1), 86.0% (2), 88.3% (3), 86.5% (4), 88.5% (5), 87.7% (6), 96.3% (7).
- **Trend**: Steady upward trajectory with minor fluctuations.
- **Iterative Learning (Cumulative)**:
- Starts at 91.2% (checkpoint 1) and increases to 95.9% (checkpoint 6).
- Key values: 91.2% (1), 93.9% (2), 95.9% (6).
- **Trend**: Gradual upward slope.
- **Sampling Only (Cumulative)**:
- Starts at 82.8% (checkpoint 1) and rises to 91.5% (checkpoint 7).
- Key values: 82.8% (1), 86.4% (3), 89.8% (5), 91.5% (7).
- **Trend**: Consistent upward slope.
- **SFT Baseline (Pass@1)**:
- Flat line at 80.8% across all checkpoints.
#### SC@k Graph
- **Sampling Only (SC@k)**:
- Starts at 81.6% (k=10) and increases to 84.4% (k=60).
- Key values: 82.8% (k=15), 83.8% (k=20), 84.1% (k=25), 84.2% (k=35), 84.4% (k=60).
- **Trend**: Slight upward slope with diminishing returns.
- **SFT Baseline (Pass@1)**:
- Flat line at 80.8% across all k values.
---
### Key Observations
1. **SciQ Graph**:
- Iterative Learning (Cumulative) outperforms all methods, reaching 95.9% at checkpoint 6.
- Sampling Only (Cumulative) shows the steepest improvement among non-iterative methods.
- SFT Baseline remains stagnant at 80.8%, indicating no improvement with checkpoints.
2. **SC@k Graph**:
- Sampling Only (SC@k) improves marginally with increased k (81.6% → 84.4%).
- SFT Baseline remains unchanged, suggesting no benefit from scaling k.
---
### Interpretation
- **Iterative Learning Dominance**: The SciQ graph demonstrates that iterative learning methods (especially cumulative approaches) significantly outperform sampling-only and baseline methods. This suggests that iterative refinement of checkpoints is critical for high performance.
- **Diminishing Returns in Sampling**: The SC@k graph shows that increasing the number of samples (k) yields only modest gains for Sampling Only, implying that iterative strategies are more efficient than brute-force sampling.
- **SFT Baseline Limitation**: The flat performance of the SFT Baseline across both graphs highlights its inability to adapt to incremental improvements, positioning it as a static reference point.
- **Checkpoint vs. Sample Tradeoff**: While checkpoints drive substantial gains in SciQ, scaling samples (k) in SC@k has limited impact, emphasizing the importance of iterative training over static sampling.
The data underscores the superiority of iterative learning frameworks in dynamic evaluation settings, while sampling-only approaches offer incremental but less impactful improvements.