## Line Chart: Step Length vs Reasoning Tokens for Zero Shot Hard Blocksworld
### Overview
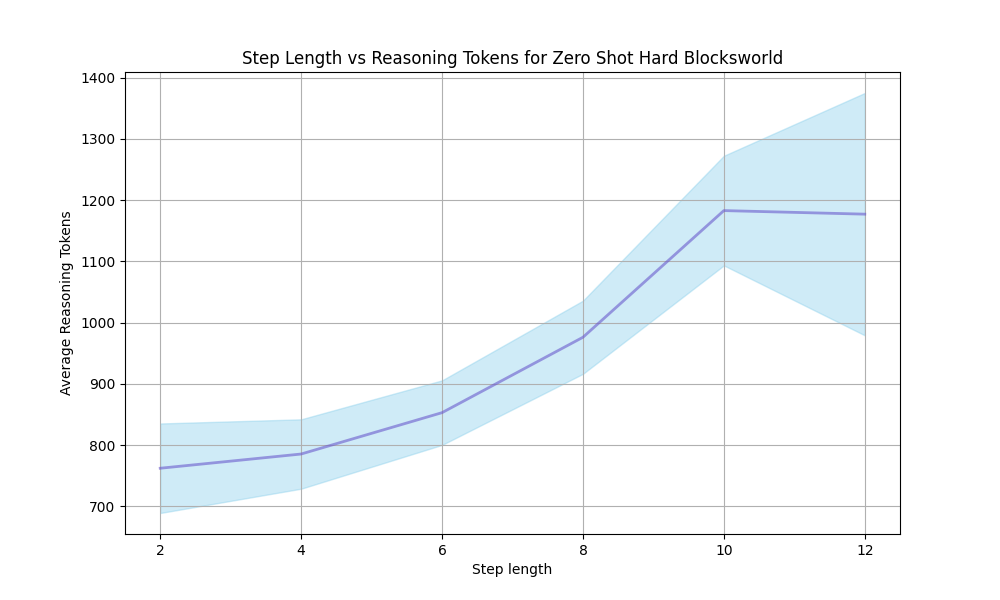
The chart illustrates the relationship between step length (x-axis) and average reasoning tokens (y-axis) for a zero-shot hard Blocksworld task. A blue line represents the average reasoning tokens, with a shaded blue region indicating variability or confidence intervals. The x-axis ranges from 2 to 12, and the y-axis spans 700 to 1400 tokens.
### Components/Axes
- **Title**: "Step Length vs Reasoning Tokens for Zero Shot Hard Blocksworld" (top-center).
- **X-axis**: "Step length" (horizontal), labeled with integer values from 2 to 12.
- **Y-axis**: "Average Reasoning Tokens" (vertical), labeled with values from 700 to 1400 in increments of 100.
- **Legend**: Located on the right, labeled "Average Reasoning Tokens" with a blue line and shaded blue region.
- **Shaded Region**: A lighter blue area surrounding the blue line, representing variability or uncertainty.
### Detailed Analysis
- **Step Length 2**:
- Average tokens: ~750 (blue line).
- Shaded bounds: ~700 (lower) to ~825 (upper).
- **Step Length 4**:
- Average tokens: ~780.
- Shaded bounds: ~725 to ~850.
- **Step Length 6**:
- Average tokens: ~875.
- Shaded bounds: ~800 to ~950.
- **Step Length 8**:
- Average tokens: ~975.
- Shaded bounds: ~900 to ~1050.
- **Step Length 10**:
- Average tokens: ~1175.
- Shaded bounds: ~1075 to ~1350.
- **Step Length 12**:
- Average tokens: ~1170.
- Shaded bounds: ~975 to ~1375.
### Key Observations
1. **Trend**: The average reasoning tokens generally increase with step length, peaking at step 10 (~1175 tokens) before slightly declining at step 12 (~1170 tokens).
2. **Variability**: The shaded region widens as step length increases, indicating greater uncertainty or variability in reasoning tokens for longer steps.
3. **Anomaly**: A minor drop in average tokens at step 12 compared to step 10, despite the overall upward trend.
### Interpretation
The data suggests that longer step lengths require more reasoning tokens on average, but the relationship is not strictly linear. The shaded region’s expansion at higher step lengths implies increased complexity or unpredictability in the task as steps grow longer. The slight decline at step 12 could reflect optimization limits or task-specific constraints. The variability pattern highlights that longer steps may involve more divergent reasoning paths, requiring further investigation into task design or model efficiency.