## Pairwise Scatter Plot Matrix of Language Model Outputs
### Overview
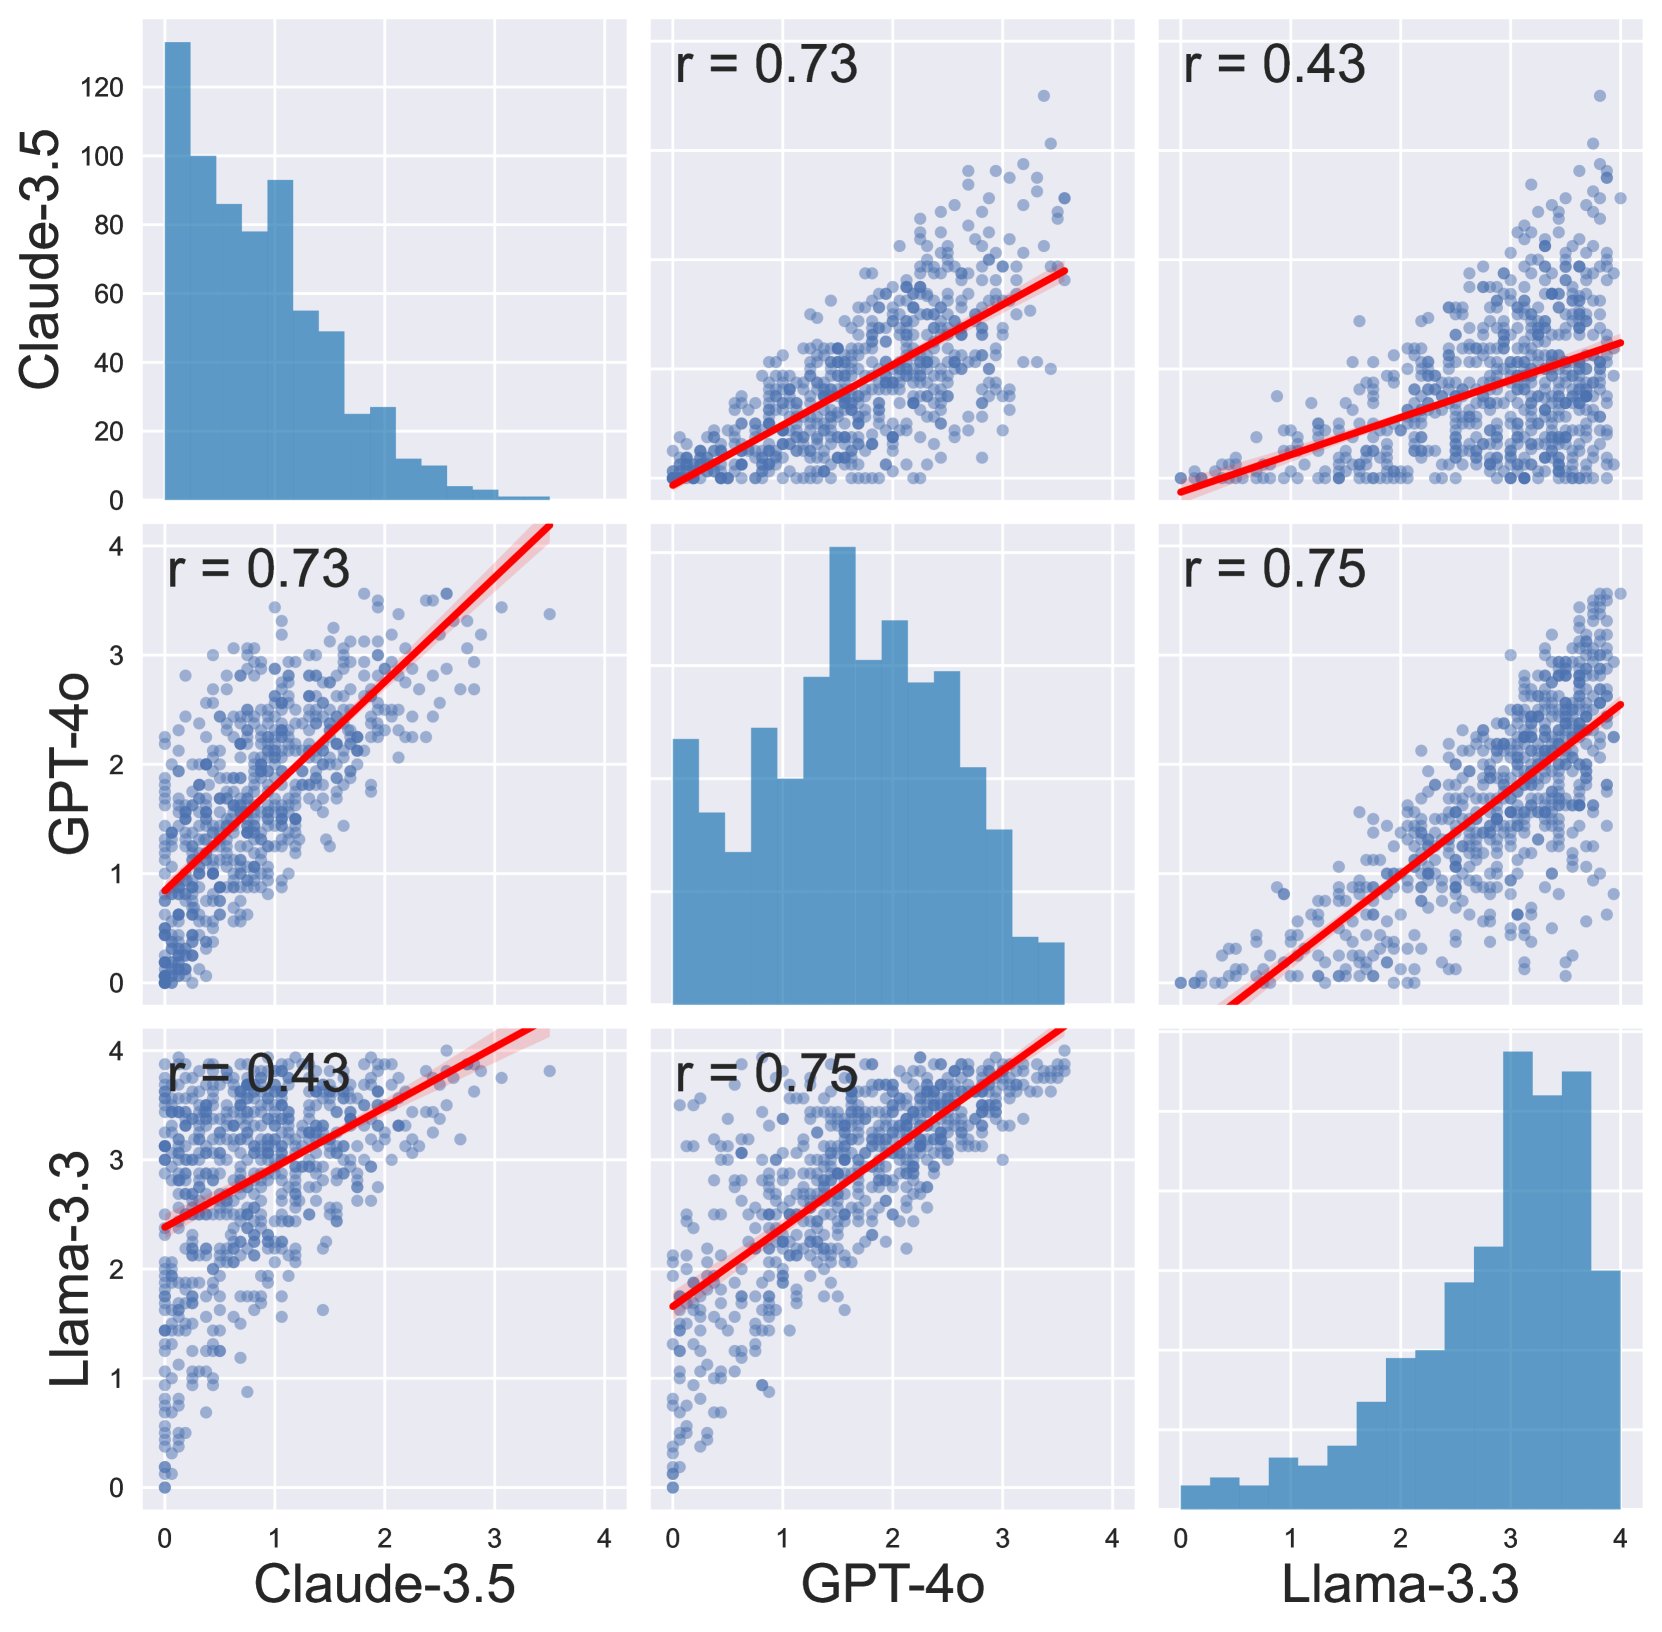
The image is a pairwise scatter plot matrix comparing the outputs of three language models: Claude-3.5, GPT-4o, and Llama-3.3. The diagonal shows histograms of each model's output distribution. The off-diagonal plots show scatter plots of the outputs of each pair of models, along with a red line indicating the linear regression fit. The correlation coefficient 'r' is displayed on each scatter plot.
### Components/Axes
* **Axes Labels:**
* X-axis and Y-axis labels are the names of the language models: Claude-3.5, GPT-4o, and Llama-3.3.
* The axes range from approximately 0 to 4.
* The histogram axes range from 0 to approximately 120 for Claude-3.5, and 0 to 4 for GPT-4o and Llama-3.3.
* **Histograms (Diagonal):**
* Claude-3.5: Histogram shows a right-skewed distribution, with most values concentrated between 0 and 2.
* GPT-4o: Histogram shows a more uniform distribution between 0 and 4.
* Llama-3.3: Histogram shows a right-skewed distribution, with most values concentrated between 2 and 4.
* **Scatter Plots (Off-Diagonal):**
* Each scatter plot shows the relationship between two language models' outputs.
* A red line indicates the linear regression fit.
* The correlation coefficient 'r' is displayed on each plot.
### Detailed Analysis
* **Claude-3.5 vs. GPT-4o (Top-Middle):**
* Scatter plot shows a positive correlation.
* The red regression line slopes upward.
* r = 0.73
* **Claude-3.5 vs. Llama-3.3 (Top-Right):**
* Scatter plot shows a positive correlation.
* The red regression line slopes upward.
* r = 0.43
* **GPT-4o vs. Claude-3.5 (Middle-Left):**
* Scatter plot shows a positive correlation.
* The red regression line slopes upward.
* r = 0.73
* **GPT-4o vs. Llama-3.3 (Middle-Right):**
* Scatter plot shows a positive correlation.
* The red regression line slopes upward.
* r = 0.75
* **Llama-3.3 vs. Claude-3.5 (Bottom-Left):**
* Scatter plot shows a positive correlation.
* The red regression line slopes upward.
* r = 0.43
* **Llama-3.3 vs. GPT-4o (Bottom-Middle):**
* Scatter plot shows a positive correlation.
* The red regression line slopes upward.
* r = 0.75
### Key Observations
* GPT-4o and Llama-3.3 have the highest correlation (r = 0.75).
* Claude-3.5 and Llama-3.3 have the lowest correlation (r = 0.43).
* Claude-3.5's output distribution is skewed towards lower values compared to GPT-4o and Llama-3.3.
* GPT-4o's output distribution is more uniform.
* Llama-3.3's output distribution is skewed towards higher values.
### Interpretation
The scatter plot matrix provides insights into the relationships between the outputs of the three language models. The correlation coefficients indicate the strength and direction of the linear relationship between each pair of models. The histograms reveal the distribution of outputs for each model.
The high correlation between GPT-4o and Llama-3.3 suggests that these models tend to produce similar outputs. The lower correlation between Claude-3.5 and Llama-3.3 indicates that these models' outputs are less aligned. The differences in output distributions suggest that each model has a different response profile.
The data suggests that GPT-4o and Llama-3.3 may be more similar in their behavior, while Claude-3.5 exhibits distinct characteristics. This information could be valuable for selecting the appropriate model for a specific task or for combining the outputs of multiple models to improve performance.