TECHNICAL ASSET FINGERPRINT
375db43d8e59386a21bc89bc
Click to view fullscreen
Press ESC or click to close
FOUND IN PAPERS
EXPERT: gemini-2.5-flash-lite-free VERSION 1
RUNTIME: google-free/gemini-2.5-flash-lite
INTEL_VERIFIED
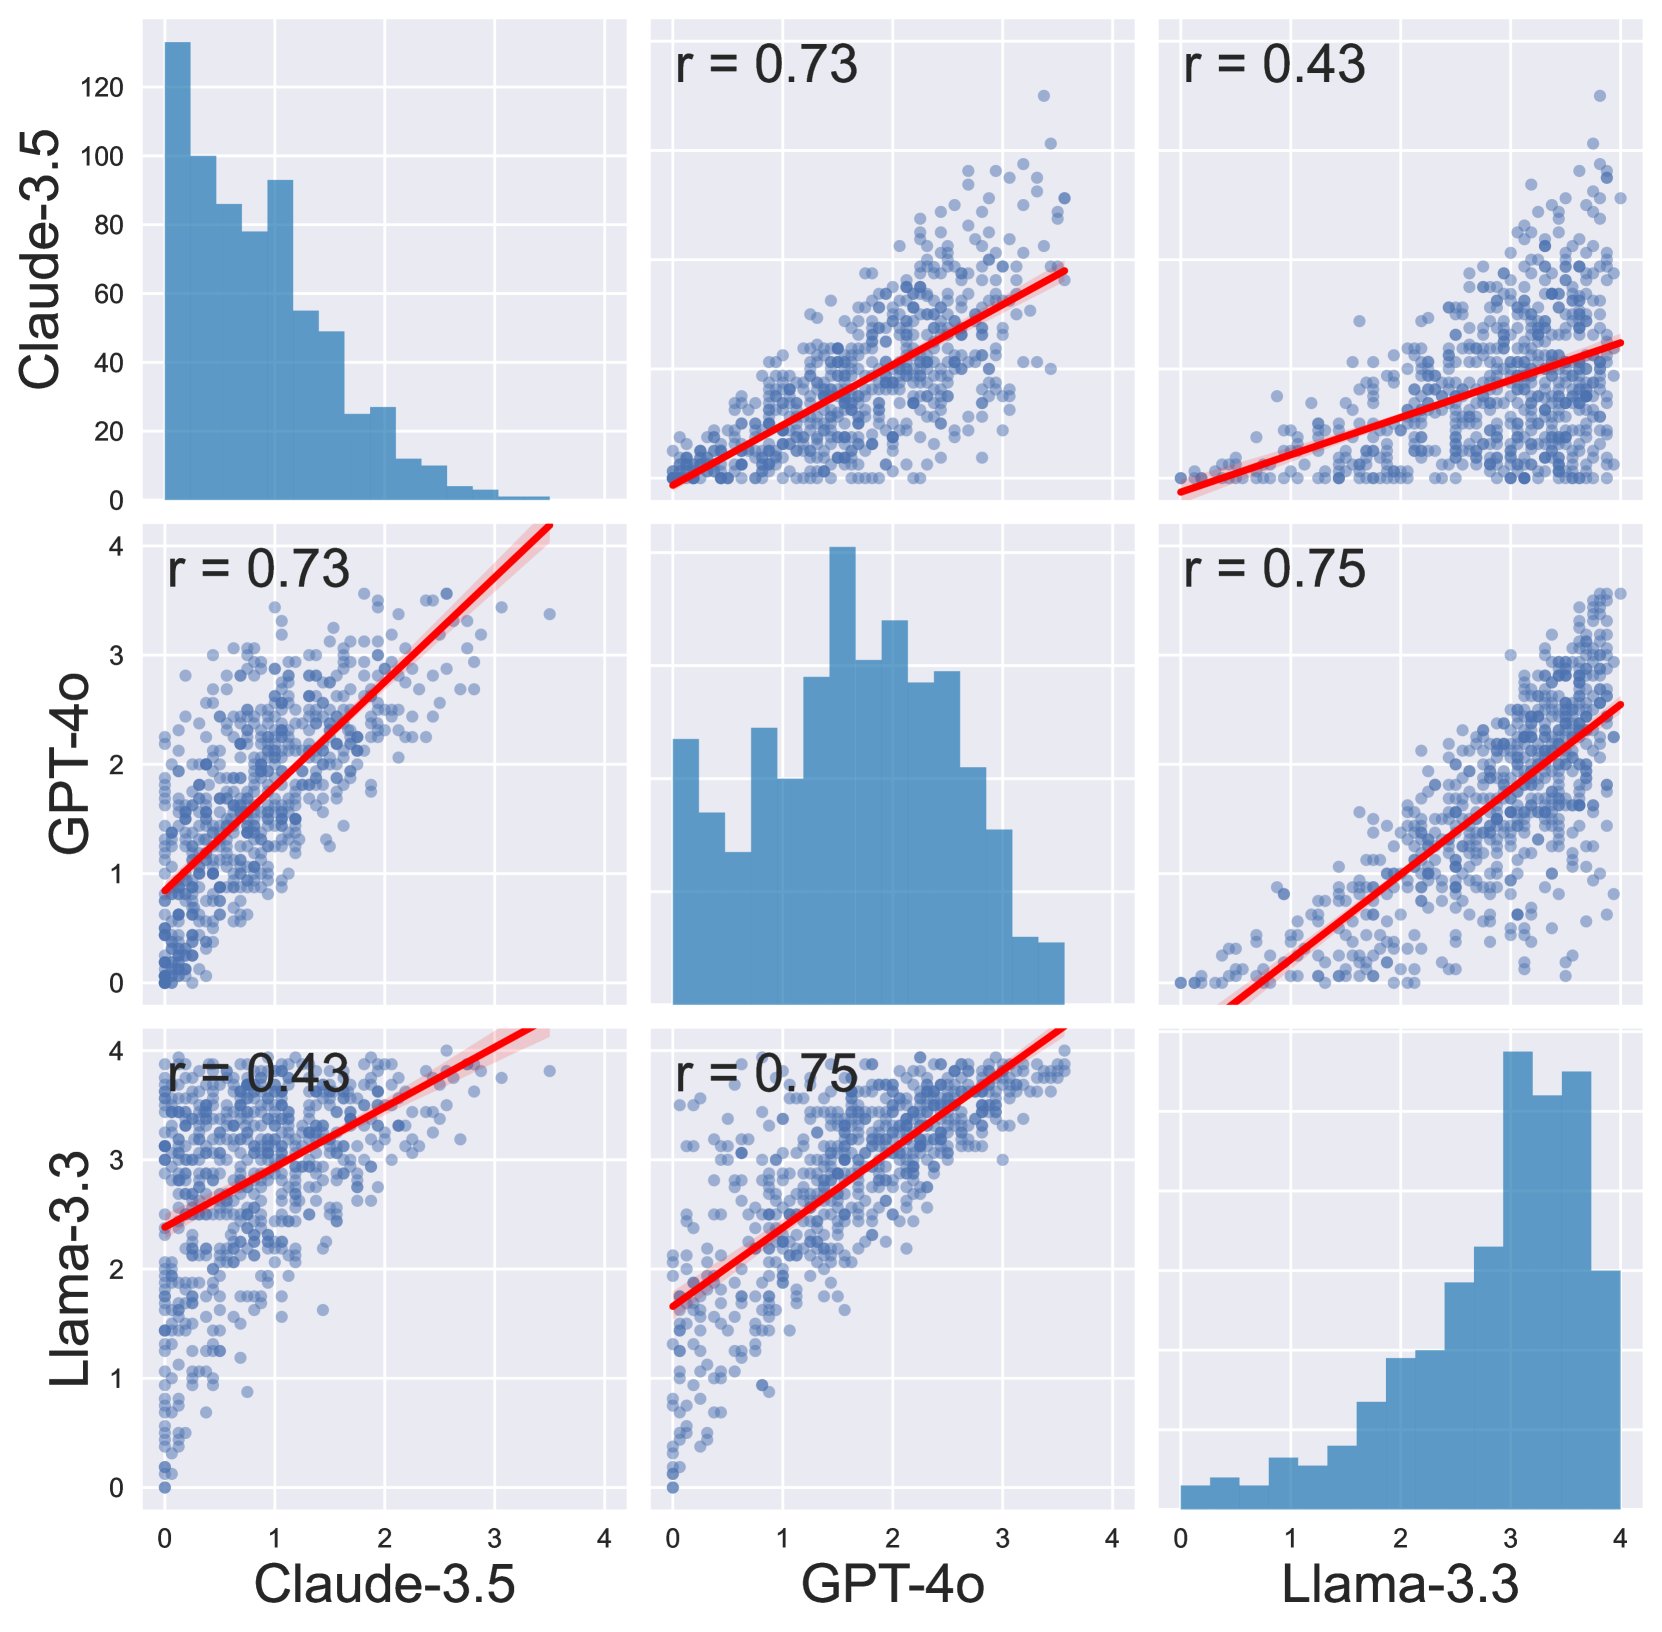
## Pair Plot: Correlation Analysis of Language Model Performance
### Overview
This image is a pair plot, also known as a scatter plot matrix, visualizing the pairwise relationships between three language models: Claude-3.5, GPT-4o, and Llama-3.3. The diagonal elements of the matrix display histograms of the individual model scores, while the off-diagonal elements show scatter plots of the scores for each pair of models, along with a regression line and the Pearson correlation coefficient (r).
### Components/Axes
**Overall Structure:** The plot is a 3x3 grid.
**Labels:**
* **Y-axis labels (left column):**
* "Claude-3.5" (top row)
* "GPT-4o" (middle row)
* "Llama-3.3" (bottom row)
* **X-axis labels (bottom row):**
* "Claude-3.5" (left column)
* "GPT-4o" (middle column)
* "Llama-3.3" (right column)
**Axis Ticks and Ranges:**
* **Y-axis (left column):** Ranges from 0 to 120 (for Claude-3.5 histogram) and 0 to 4 (for scatter plots).
* **X-axis (bottom row):** Ranges from 0 to 4 for all scatter plots and histograms.
**Correlation Coefficients (r):** Displayed in the top-left corner of each off-diagonal scatter plot.
* Top-middle plot (Claude-3.5 vs. GPT-4o): r = 0.73
* Top-right plot (Claude-3.5 vs. Llama-3.3): r = 0.43
* Middle-left plot (GPT-4o vs. Claude-3.5): r = 0.73
* Middle-right plot (GPT-4o vs. Llama-3.3): r = 0.75
* Bottom-left plot (Llama-3.3 vs. Claude-3.5): r = 0.43
* Bottom-middle plot (Llama-3.3 vs. GPT-4o): r = 0.75
**Data Representation:**
* **Histograms (Diagonal):** Blue bars representing the frequency distribution of scores for each model.
* **Scatter Plots (Off-diagonal):** Blue dots representing individual data points for pairs of models.
* **Regression Lines:** Red lines indicating the linear trend between pairs of variables.
* **Shaded Areas:** Light red shaded areas around the regression lines, likely representing confidence intervals for the regression.
### Detailed Analysis
**Diagonal Plots (Histograms):**
1. **Claude-3.5 (Top-left):**
* **Trend:** The histogram shows a distribution heavily skewed to the right. The highest frequency of scores is concentrated between 0 and 20, with a sharp decline as scores increase.
* **Data Points:** The peak frequency is approximately 120 (between 0 and 20 on the x-axis). There are very few data points above a score of 60.
2. **GPT-4o (Middle-center):**
* **Trend:** This histogram appears to be bimodal or has a plateau. There's a significant peak around a score of 2, and another smaller peak or plateau around a score of 3. The distribution is more spread out than Claude-3.5.
* **Data Points:** The highest bars are around a score of 2 and 3, with frequencies roughly estimated between 20-30.
3. **Llama-3.3 (Bottom-right):**
* **Trend:** This histogram shows a distribution that is skewed to the left. The scores are more evenly distributed across a wider range, with a peak around a score of 3.
* **Data Points:** The bars are relatively uniform from approximately a score of 1 to 3, with the highest bars around a score of 3, estimated to have frequencies between 20-30.
**Off-Diagonal Plots (Scatter Plots with Regression Lines):**
1. **Claude-3.5 vs. GPT-4o (Top-middle):**
* **Trend:** The scatter plot shows a strong positive linear trend. As Claude-3.5 scores increase, GPT-4o scores tend to increase. The red regression line slopes upward from the bottom-left to the top-right.
* **Data Points:** Points are clustered along the regression line, with some spread. Scores for both models range from approximately 0 to 4.
2. **Claude-3.5 vs. Llama-3.3 (Top-right):**
* **Trend:** The scatter plot shows a moderate positive linear trend. As Claude-3.5 scores increase, Llama-3.3 scores tend to increase, but with more scatter than the Claude-3.5 vs. GPT-4o relationship. The red regression line slopes upward.
* **Data Points:** Points are more dispersed compared to the previous plot. Scores for both models range from approximately 0 to 4.
3. **GPT-4o vs. Claude-3.5 (Middle-left):**
* **Trend:** This plot is the transpose of the top-middle plot and shows a strong positive linear trend, consistent with the r = 0.73 value. As GPT-4o scores increase, Claude-3.5 scores tend to increase. The red regression line slopes upward.
* **Data Points:** Similar distribution to the top-middle plot.
4. **GPT-4o vs. Llama-3.3 (Middle-right):**
* **Trend:** The scatter plot shows a strong positive linear trend. As GPT-4o scores increase, Llama-3.3 scores tend to increase. The red regression line slopes upward. This appears to be the strongest correlation among the scatter plots.
* **Data Points:** Points are tightly clustered around the regression line, indicating a high degree of linear association. Scores for both models range from approximately 0 to 4.
5. **Llama-3.3 vs. Claude-3.5 (Bottom-left):**
* **Trend:** This plot is the transpose of the top-right plot and shows a moderate positive linear trend, consistent with the r = 0.43 value. As Llama-3.3 scores increase, Claude-3.5 scores tend to increase, with noticeable scatter. The red regression line slopes upward.
* **Data Points:** Similar distribution to the top-right plot.
6. **Llama-3.3 vs. GPT-4o (Bottom-middle):**
* **Trend:** This plot is the transpose of the middle-right plot and shows a strong positive linear trend, consistent with the r = 0.75 value. As Llama-3.3 scores increase, GPT-4o scores tend to increase. The red regression line slopes upward.
* **Data Points:** Similar distribution to the middle-right plot.
### Key Observations
* **Strongest Correlation:** GPT-4o and Llama-3.3 exhibit the strongest positive linear correlation (r = 0.75).
* **Moderate Correlation:** Claude-3.5 and GPT-4o show a strong positive correlation (r = 0.73).
* **Weakest Correlation:** Claude-3.5 and Llama-3.3 have the weakest positive correlation among the pairs (r = 0.43).
* **Score Distributions:**
* Claude-3.5 scores are heavily concentrated at lower values, with a long tail towards higher scores.
* GPT-4o scores are more spread out, with peaks around 2 and 3.
* Llama-3.3 scores are also spread out, with a peak around 3.
* **Visual Consistency:** The scatter plots and their corresponding correlation coefficients align visually. The plots with higher 'r' values show points more tightly clustered around the regression line, while plots with lower 'r' values show more dispersion.
### Interpretation
This pair plot provides a comprehensive view of the performance correlations between three language models. The data suggests that:
1. **GPT-4o and Llama-3.3 are highly correlated:** Their performance tends to move in tandem. When one performs well, the other is likely to perform well, and vice-versa. This could indicate they share similar underlying strengths or are evaluated on similar tasks where their capabilities align.
2. **Claude-3.5 and GPT-4o are also strongly correlated:** Similar to the above, their performance is closely linked, though slightly less so than GPT-4o and Llama-3.3.
3. **Claude-3.5 and Llama-3.3 have a weaker relationship:** While there's a positive correlation, their performance is less predictable based on each other compared to the other pairs. This might imply they excel in different areas or are sensitive to different aspects of the evaluation tasks.
4. **Score Distribution Differences:** The histograms highlight distinct performance profiles. Claude-3.5's distribution suggests it might be more prone to lower scores or perhaps evaluated on tasks where it struggles more frequently, despite having a tail of high scores. GPT-4o and Llama-3.3 appear to have more consistent performance across a moderate range of scores.
In essence, the data demonstrates that GPT-4o and Llama-3.3 are the most similar in their performance patterns, followed by Claude-3.5 and GPT-4o. Claude-3.5 and Llama-3.3 show the least agreement in their performance. This analysis is crucial for understanding the relative strengths and weaknesses of these models and for selecting the most appropriate model for specific applications based on desired performance characteristics. The presence of regression lines and confidence intervals allows for a more nuanced understanding of the linear association and its reliability.
DECODING INTELLIGENCE...