## Heatmap: R1-Llama Performance on Different Datasets
### Overview
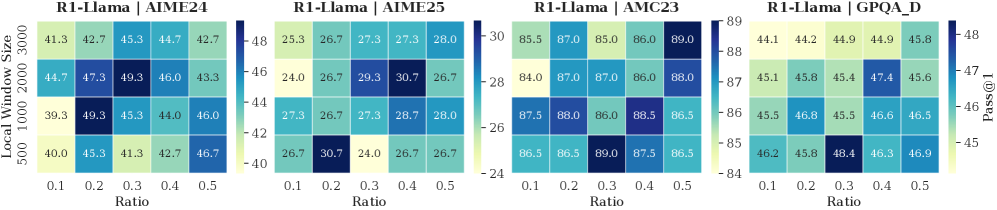
The image presents four heatmaps, each displaying the performance of the R1-Llama model on a different dataset (AIME24, AIME25, AMC23, and GPQA_D). The heatmaps show the "Pass@1" metric, which is a measure of accuracy, across different "Local Window Sizes" and "Ratio" values. The color intensity represents the performance level, with darker shades indicating higher "Pass@1" values.
### Components/Axes
* **Titles:** Each heatmap has a title in the format "R1-Llama | [Dataset Name]". The datasets are AIME24, AIME25, AMC23, and GPQA_D.
* **Y-axis:** "Local Window Size" with values 500, 1000, 2000, and 3000.
* **X-axis:** "Ratio" with values 0.1, 0.2, 0.3, 0.4, and 0.5.
* **Color Scale (Right of AIME25 and GPQA_D):**
* The color scale represents the "Pass@1" values.
* AIME24: Ranges from approximately 40 to 48.
* AIME25: Ranges from approximately 24 to 30.
* AMC23: Ranges from approximately 84 to 89.
* GPQA_D: Ranges from approximately 45 to 48.
* **Pass@1 (Right of GPQA_D):** Label for the color scale.
### Detailed Analysis
**R1-Llama | AIME24**
| Local Window Size | Ratio 0.1 | Ratio 0.2 | Ratio 0.3 | Ratio 0.4 | Ratio 0.5 |
| ----------------- | --------- | --------- | --------- | --------- | --------- |
| 3000 | 41.3 | 42.7 | 45.3 | 44.7 | 42.7 |
| 2000 | 44.7 | 47.3 | 49.3 | 46.0 | 43.3 |
| 1000 | 39.3 | 49.3 | 45.3 | 44.0 | 46.0 |
| 500 | 40.0 | 45.3 | 41.3 | 42.7 | 46.7 |
* Trend: The highest "Pass@1" values are generally observed at a "Ratio" of 0.2 or 0.3 and a "Local Window Size" of 1000 or 2000.
**R1-Llama | AIME25**
| Local Window Size | Ratio 0.1 | Ratio 0.2 | Ratio 0.3 | Ratio 0.4 | Ratio 0.5 |
| ----------------- | --------- | --------- | --------- | --------- | --------- |
| 3000 | 25.3 | 26.7 | 27.3 | 27.3 | 28.0 |
| 2000 | 24.0 | 26.7 | 29.3 | 30.7 | 26.7 |
| 1000 | 27.3 | 26.7 | 27.3 | 28.7 | 28.0 |
| 500 | 26.7 | 30.7 | 24.0 | 26.7 | 26.7 |
* Trend: The highest "Pass@1" values are observed at a "Ratio" of 0.2 and a "Local Window Size" of 500, and at a "Ratio" of 0.4 and a "Local Window Size" of 2000.
**R1-Llama | AMC23**
| Local Window Size | Ratio 0.1 | Ratio 0.2 | Ratio 0.3 | Ratio 0.4 | Ratio 0.5 |
| ----------------- | --------- | --------- | --------- | --------- | --------- |
| 3000 | 85.5 | 87.0 | 85.0 | 86.0 | 89.0 |
| 2000 | 84.0 | 87.0 | 87.0 | 86.0 | 88.0 |
| 1000 | 87.5 | 88.0 | 86.0 | 88.5 | 86.5 |
| 500 | 86.5 | 86.5 | 89.0 | 87.5 | 86.5 |
* Trend: The "Pass@1" values are generally high across all "Ratio" and "Local Window Size" combinations. The highest value is observed at a "Ratio" of 0.3 and a "Local Window Size" of 500.
**R1-Llama | GPQA_D**
| Local Window Size | Ratio 0.1 | Ratio 0.2 | Ratio 0.3 | Ratio 0.4 | Ratio 0.5 |
| ----------------- | --------- | --------- | --------- | --------- | --------- |
| 3000 | 44.1 | 44.2 | 44.9 | 44.9 | 45.8 |
| 2000 | 45.1 | 45.8 | 45.4 | 47.4 | 45.6 |
| 1000 | 45.5 | 46.8 | 45.5 | 46.6 | 46.5 |
| 500 | 46.2 | 45.8 | 48.4 | 46.3 | 46.9 |
* Trend: The highest "Pass@1" value is observed at a "Ratio" of 0.3 and a "Local Window Size" of 500.
### Key Observations
* The performance of R1-Llama varies significantly across different datasets.
* The optimal "Ratio" and "Local Window Size" settings depend on the specific dataset.
* AMC23 generally shows the highest "Pass@1" values, while AIME25 shows the lowest.
### Interpretation
The heatmaps illustrate the sensitivity of the R1-Llama model to different hyperparameter settings ("Ratio" and "Local Window Size") and datasets. The varying performance across datasets suggests that the model's ability to generalize depends on the characteristics of the data. The optimal hyperparameter settings appear to be dataset-specific, indicating that careful tuning is necessary to achieve the best performance on a given task. The high performance on AMC23 could be attributed to the nature of the questions in that dataset, while the lower performance on AIME25 might indicate greater complexity or difficulty.