\n
## Scatter Plot: BLEU Score vs. Edit Distance with Distribution Shift
### Overview
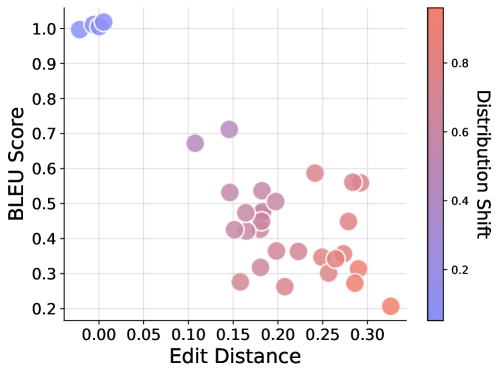
The image presents a scatter plot visualizing the relationship between BLEU score and Edit Distance, with a third dimension represented by color-coding based on Distribution Shift. The plot consists of numerous data points, each representing a specific instance or observation. The points are colored according to their Distribution Shift value, ranging from blue (low shift) to red (high shift).
### Components/Axes
* **X-axis:** Edit Distance, ranging from approximately 0.00 to 0.30.
* **Y-axis:** BLEU Score, ranging from approximately 0.20 to 1.00.
* **Color Scale (Legend):** Distribution Shift, ranging from approximately 0.2 to 0.8. The legend is positioned on the right side of the plot.
* Blue: ~0.2
* Light Purple: ~0.4
* Pink: ~0.6
* Red: ~0.8
### Detailed Analysis
The data points are clustered in a few areas.
* **Cluster 1 (Top-Left):** A small cluster of points with very low Edit Distance (around 0.00-0.05) and high BLEU scores (around 0.95-1.00). These points are colored blue, indicating a low Distribution Shift (approximately 0.2).
* **Cluster 2 (Center-Left):** A larger cluster of points with Edit Distance ranging from approximately 0.10 to 0.20 and BLEU scores ranging from approximately 0.40 to 0.70. The color of these points transitions from light purple to pink, indicating a Distribution Shift ranging from approximately 0.4 to 0.6.
* **Cluster 3 (Center-Right):** A cluster of points with Edit Distance ranging from approximately 0.20 to 0.30 and BLEU scores ranging from approximately 0.30 to 0.60. These points are colored pink to red, indicating a Distribution Shift ranging from approximately 0.6 to 0.8.
* **Trend:** As Edit Distance increases, BLEU score generally decreases. There is a clear negative correlation between the two variables. The color gradient suggests that higher Edit Distance is associated with higher Distribution Shift.
Here's a more detailed breakdown of approximate data points (with uncertainty due to visual estimation):
| Edit Distance (approx.) | BLEU Score (approx.) | Distribution Shift (approx.) |
|---|---|---|
| 0.02 | 0.98 | 0.2 |
| 0.03 | 1.00 | 0.2 |
| 0.04 | 0.95 | 0.2 |
| 0.12 | 0.65 | 0.4 |
| 0.15 | 0.50 | 0.5 |
| 0.18 | 0.45 | 0.5 |
| 0.20 | 0.60 | 0.6 |
| 0.22 | 0.40 | 0.6 |
| 0.25 | 0.55 | 0.7 |
| 0.27 | 0.35 | 0.7 |
| 0.30 | 0.30 | 0.8 |
### Key Observations
* The points with the highest BLEU scores have very low Edit Distance and low Distribution Shift.
* As Edit Distance increases, BLEU scores tend to decrease, and Distribution Shift tends to increase.
* There is a noticeable spread in the data, indicating variability in the relationship between the variables.
* The data does not appear to be linearly correlated, but rather shows a general downward trend.
### Interpretation
This scatter plot likely represents the performance of a machine translation or text generation system. BLEU score is a common metric for evaluating the quality of machine-generated text, while Edit Distance measures the number of edits (insertions, deletions, substitutions) required to transform one string into another. Distribution Shift refers to the difference between the training data distribution and the test data distribution.
The plot suggests that when the Edit Distance between the generated text and the reference text is low (meaning the generated text is similar to the reference text), the BLEU score is high, and the Distribution Shift is low. This indicates that the system performs well when the test data is similar to the training data. However, as the Edit Distance increases (meaning the generated text is less similar to the reference text), the BLEU score decreases, and the Distribution Shift increases. This suggests that the system's performance degrades when the test data is different from the training data.
The presence of a Distribution Shift is a critical factor affecting the performance of the system. When the test data distribution differs significantly from the training data distribution, the system may struggle to generate accurate and fluent text. This highlights the importance of considering Distribution Shift when evaluating and deploying machine translation or text generation systems. The outliers may represent cases where the system performs unexpectedly well or poorly, potentially due to specific characteristics of the input data or the system's architecture.