\n
## Diagram: State Transition with Rewards and Penalties
### Overview
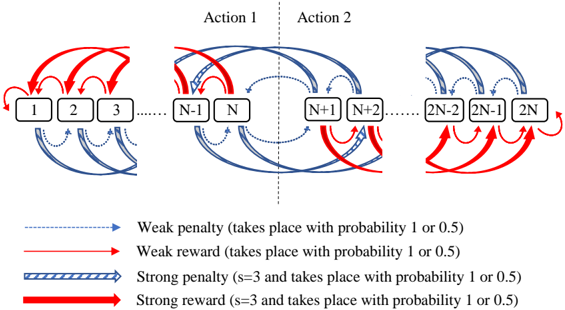
The image depicts a diagram illustrating a state transition process with two possible actions and associated rewards and penalties. The diagram shows a sequence of states numbered from 1 to 2N, with transitions between states governed by actions and probabilistic rewards/penalties. The diagram is divided into three sections, showing the initial states, a central section highlighting actions, and the final states.
### Components/Axes
The diagram consists of:
* **States:** Represented by numbered squares (1, 2, 3, ..., N-1, N, N+1, N+2, ..., 2N-2, 2N-1, 2N).
* **Actions:** Labeled "Action 1" and "Action 2" positioned above the central states.
* **Transitions:** Represented by arrows indicating possible state transitions.
* **Reward/Penalty Indicators:** Different colored and styled arrows represent different types of rewards and penalties.
* **Legend:** Located at the bottom of the diagram, explaining the meaning of the arrow styles and colors.
The legend defines the following:
* **Blue dashed arrow:** Weak penalty (takes place with probability 1 or 0.5)
* **Red solid arrow:** Weak reward (takes place with probability 1 or 0.5)
* **Blue wide dashed arrow:** Strong penalty (s=3 and takes place with probability 1 or 0.5)
* **Red wide solid arrow:** Strong reward (s=3 and takes place with probability 1 or 0.5)
### Detailed Analysis / Content Details
The diagram shows a series of states transitioning based on actions and probabilistic rewards/penalties.
* **Initial States (1-3):** State 1 transitions to states 2 and 3. State 2 transitions to states 1 and 3. State 3 transitions to itself, and to states 1 and 2. The transitions are a mix of weak rewards (red arrows) and weak penalties (blue dashed arrows).
* **Central States (N-1, N, N+1, N+2):** State N-1 transitions to states N, N+1, and potentially others. State N transitions to states N-1, N+1, and potentially others. State N+1 transitions to states N, N+2, and potentially others. State N+2 transitions to states N+1 and potentially others. This section highlights the application of "Action 1" and "Action 2". Transitions include both weak and strong rewards/penalties.
* **Final States (2N-2, 2N-1, 2N):** State 2N-2 transitions to states 2N-1 and 2N. State 2N-1 transitions to states 2N-2 and 2N. State 2N transitions to states 2N-1 and 2N-2. The transitions are a mix of weak rewards (red arrows) and weak penalties (blue dashed arrows).
Specifically:
* From state 1, there is a red arrow to state 2 (weak reward) and a blue dashed arrow to state 3 (weak penalty).
* From state 2, there is a red arrow to state 1 (weak reward) and a blue dashed arrow to state 3 (weak penalty).
* From state 3, there is a red arrow to state 1 (weak reward), a blue dashed arrow to state 2 (weak penalty), and a loop back to itself.
* The central section shows transitions between N-1, N, N+1, and N+2 with a mix of all four reward/penalty types.
* The final section mirrors the initial section in terms of transition patterns.
### Key Observations
* The diagram illustrates a Markov Decision Process (MDP) or a similar state-transition model.
* The probabilities of rewards and penalties are either 1 or 0.5, indicating a stochastic environment.
* The "strong" rewards/penalties (s=3) are visually distinguished by thicker lines.
* The diagram suggests a cyclical nature to the state transitions, particularly in the initial and final states.
* The actions "Action 1" and "Action 2" influence the transitions between states N-1, N, N+1, and N+2.
### Interpretation
The diagram represents a system where an agent navigates through a series of states, taking actions that lead to probabilistic rewards or penalties. The presence of both weak and strong rewards/penalties suggests a complex reward structure. The cyclical nature of the transitions in the initial and final states implies that the agent can revisit previously visited states. The actions "Action 1" and "Action 2" represent the agent's choices, and their impact on the state transitions is central to the system's dynamics. The parameter 's=3' associated with strong rewards/penalties likely represents a state or condition that triggers these more significant outcomes.
The diagram is a visual representation of a reinforcement learning problem, where the agent learns to maximize its cumulative reward by choosing optimal actions in each state. The probabilistic nature of the rewards and penalties introduces uncertainty, requiring the agent to learn a policy that is robust to this uncertainty. The diagram could be used to model a variety of real-world systems, such as game playing, robotics, or financial markets. The diagram is a conceptual model and does not provide specific numerical data about the probabilities or reward values.