\n
## Scatter Plot: World Religions Confidence vs. Target Length
### Overview
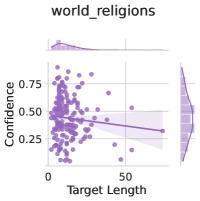
The image presents a scatter plot visualizing the relationship between "Target Length" and "Confidence" for a dataset labeled "world_religions". A regression line with a shaded confidence interval is overlaid on the scatter points. There are also density plots along the top and right edges of the chart.
### Components/Axes
* **Title:** "world\_religions" (top-center)
* **X-axis:** "Target Length" (bottom-center), ranging from approximately 0 to 60.
* **Y-axis:** "Confidence" (left-center), ranging from approximately 0.05 to 0.85.
* **Scatter Points:** Numerous purple dots representing individual data points.
* **Regression Line:** A purple line indicating the trend in the data.
* **Confidence Interval:** A shaded purple area around the regression line, representing the uncertainty in the trend.
* **Density Plot (Top):** A purple shaded area representing the distribution of "Target Length".
* **Density Plot (Right):** A purple shaded area representing the distribution of "Confidence".
### Detailed Analysis
The scatter plot shows a generally negative correlation between "Target Length" and "Confidence". As "Target Length" increases, "Confidence" tends to decrease.
* **Trend:** The regression line slopes downward from left to right, confirming the negative correlation.
* **Data Points:**
* At "Target Length" = 0, "Confidence" values range from approximately 0.1 to 0.75, with a high concentration of points around 0.5.
* At "Target Length" = 25, "Confidence" values range from approximately 0.2 to 0.6.
* At "Target Length" = 50, "Confidence" values range from approximately 0.15 to 0.45.
* At "Target Length" = 60, "Confidence" values range from approximately 0.1 to 0.3.
* **Density Plots:**
* The top density plot shows a peak in data points around a "Target Length" of 0, with a decreasing density as "Target Length" increases.
* The right density plot shows a peak in data points around a "Confidence" of 0.5, with a decreasing density as "Confidence" increases.
### Key Observations
* The relationship between "Target Length" and "Confidence" is not strictly linear, as there is considerable scatter around the regression line.
* The confidence interval is relatively wide, indicating a high degree of uncertainty in the estimated trend.
* There is a cluster of data points with low "Target Length" and high "Confidence".
* The density plots suggest that "Target Length" is skewed towards lower values, while "Confidence" is centered around 0.5.
### Interpretation
The data suggests that, for the dataset "world\_religions", longer "Target Lengths" are associated with lower "Confidence" scores. The "Target Length" could represent the length of a text or description related to a religion, and "Confidence" could represent the model's confidence in identifying or classifying that religion. The negative correlation might indicate that as the length of the description increases, the model becomes less certain about the religion being described. This could be due to increased ambiguity or complexity in longer texts. The wide confidence interval suggests that other factors may also influence the "Confidence" score, and the relationship between "Target Length" and "Confidence" is not deterministic. The density plots provide additional insight into the distribution of these variables, showing that shorter "Target Lengths" are more common and that "Confidence" scores tend to cluster around 0.5.