## Text Analysis: Financial Data and Question Answering
### Overview
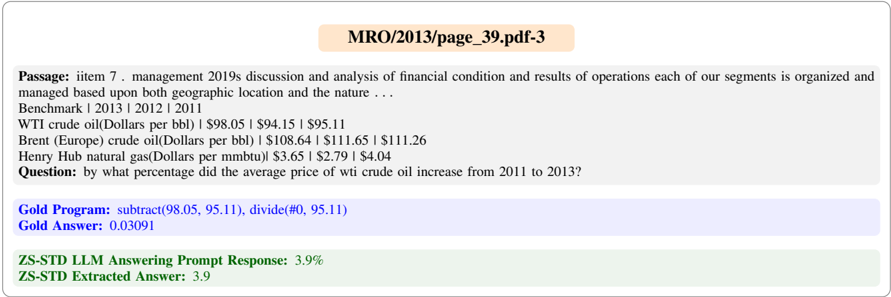
The image presents financial data related to crude oil and natural gas prices for the years 2011, 2012, and 2013. It also includes a question about the percentage increase in the average price of WTI crude oil from 2011 to 2013, along with a "Gold Program" solution and the response from a "ZS-STD LLM."
### Components/Axes
* **Title:** MRO/2013/page\_39.pdf-3
* **Passage:** A snippet from a management discussion and analysis of financial condition and results of operations.
* **Benchmark Table:**
* Columns: 2013, 2012, 2011
* Rows:
* WTI crude oil (Dollars per bbl)
* Brent (Europe) crude oil (Dollars per bbl)
* Henry Hub natural gas (Dollars per mmbtu)
* **Question:** "by what percentage did the average price of wti crude oil increase from 2011 to 2013?"
* **Gold Program:** The calculation used to determine the correct answer.
* **Gold Answer:** The correct answer to the question.
* **ZS-STD LLM Answering Prompt Response:** The answer provided by the LLM.
* **ZS-STD Extracted Answer:** The answer extracted by the LLM.
### Detailed Analysis or ### Content Details
**Benchmark Table Data:**
| Benchmark | 2013 | 2012 | 2011 |
| ------------------------------ | ------- | ------- | ------- |
| WTI crude oil (Dollars per bbl) | $98.05 | $94.15 | $95.11 |
| Brent (Europe) crude oil (Dollars per bbl) | $108.64 | $111.65 | $111.26 |
| Henry Hub natural gas (Dollars per mmbtu) | $3.65 | $2.79 | $4.04 |
**Question and Answers:**
* **Question:** by what percentage did the average price of wti crude oil increase from 2011 to 2013?
* **Gold Program:** subtract(98.05, 95.11), divide(#0, 95.11)
* **Gold Answer:** 0.03091 (or 3.091%)
* **ZS-STD LLM Answering Prompt Response:** 3.9%
* **ZS-STD Extracted Answer:** 3.9
### Key Observations
* The price of WTI crude oil increased from 2012 to 2013, but decreased from 2011 to 2012.
* The price of Brent crude oil decreased from 2011 to 2013.
* The price of Henry Hub natural gas decreased from 2011 to 2012, and increased from 2012 to 2013.
* The LLM's answer (3.9%) is close to, but not exactly the same as, the "Gold Answer" (3.091%).
### Interpretation
The data provides a snapshot of crude oil and natural gas prices over three years. The question focuses on the percentage increase of WTI crude oil between 2011 and 2013. The "Gold Program" and "Gold Answer" represent the correct calculation and result, while the "ZS-STD LLM" responses indicate the performance of a language model in answering the question. The discrepancy between the "Gold Answer" and the LLM's answer suggests a potential area for improvement in the LLM's accuracy. The passage context suggests this data is part of a larger financial analysis.