TECHNICAL ASSET FINGERPRINT
386e742c9c9e4c633e63a090
Click to view fullscreen
Press ESC or click to close
FOUND IN PAPERS
EXPERT: healer-alpha-free VERSION 1
RUNTIME: free/openrouter/healer-alpha
INTEL_VERIFIED
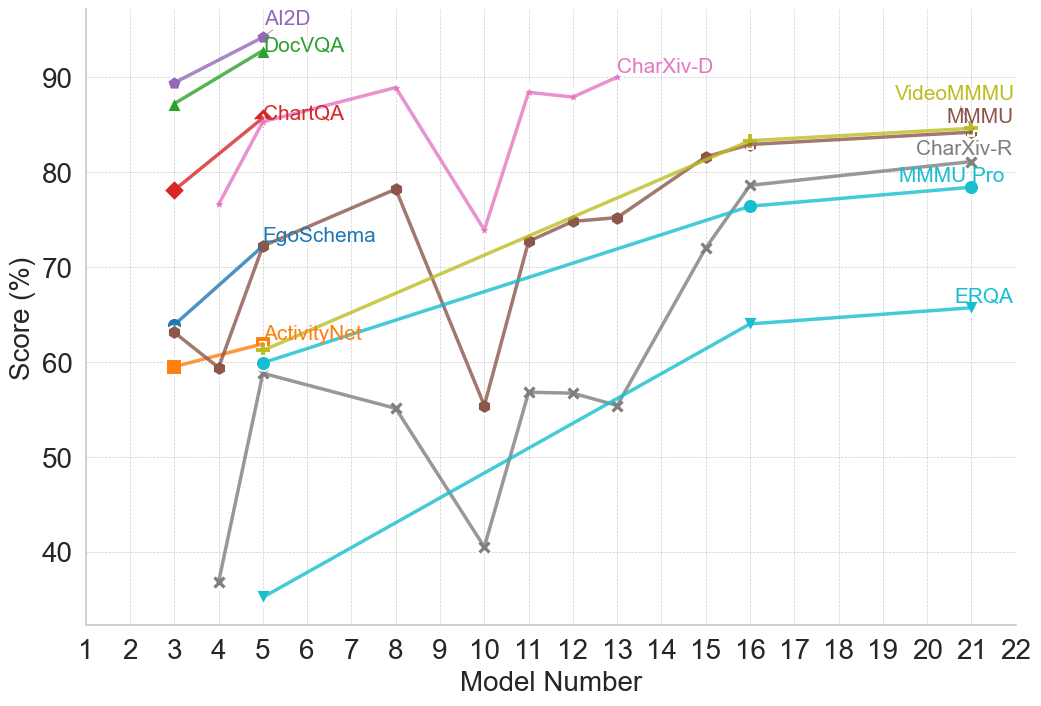
## Line Chart: Model Performance Across Multiple Benchmarks
### Overview
This is a multi-series line chart comparing the performance scores (in percentage) of various AI models, identified by a sequential "Model Number" on the x-axis, across 11 different evaluation benchmarks. The chart illustrates how different models perform on diverse tasks, showing trends of improvement, volatility, and relative performance.
### Components/Axes
* **X-Axis:** Labeled "Model Number". It is a linear scale with major tick marks and labels for integers from 1 to 22.
* **Y-Axis:** Labeled "Score (%)". It is a linear scale with major tick marks and labels at intervals of 10, from 40 to 90.
* **Legend:** The legend is integrated directly into the chart area, with labels placed near the end of their respective data lines, primarily in the top-right quadrant. The labels and their associated line colors/markers are:
* **AI2D** (Purple line, circle marker)
* **DocVQA** (Green line, triangle-up marker)
* **ChartQA** (Red line, diamond marker)
* **CharXiv-D** (Pink line, no distinct marker)
* **VideoMMMU** (Olive/Yellow-green line, plus marker)
* **MMMU** (Brown line, circle marker)
* **CharXiv-R** (Gray line, 'x' marker)
* **MMMU-Pro** (Cyan line, circle marker)
* **EgoSchema** (Blue line, circle marker)
* **ActivityNet** (Orange line, square marker)
* **ERQA** (Light blue/Teal line, triangle-down marker)
### Detailed Analysis
**Data Series and Trends:**
1. **AI2D (Purple):** Shows a strong upward trend. Starts at ~89% (Model 3), rises to ~94% (Model 5).
2. **DocVQA (Green):** Shows a strong upward trend. Starts at ~87% (Model 3), rises to ~93% (Model 5).
3. **ChartQA (Red):** Shows a strong upward trend. Starts at ~78% (Model 3), rises to ~86% (Model 5).
4. **CharXiv-D (Pink):** Exhibits high volatility. Starts at ~76% (Model 4), peaks at ~89% (Model 8), drops sharply to ~74% (Model 10), rebounds to ~88% (Model 11), and ends at ~90% (Model 13).
5. **VideoMMMU (Olive):** Shows a steady, strong upward trend. Starts at ~60% (Model 3), rises consistently to ~84% (Model 21).
6. **MMMU (Brown):** Shows a volatile but generally upward trend. Starts at ~63% (Model 3), dips to ~59% (Model 5), peaks at ~78% (Model 8), drops sharply to ~55% (Model 10), then recovers and climbs steadily to ~84% (Model 21).
7. **CharXiv-R (Gray):** Shows a volatile, then strong upward trend. Starts very low at ~37% (Model 4), jumps to ~59% (Model 5), declines to ~55% (Model 8), drops to a low of ~40% (Model 10), then begins a strong, steady ascent to ~81% (Model 21).
8. **MMMU-Pro (Cyan):** Shows a steady, strong upward trend. Starts at ~60% (Model 5), rises consistently to ~78% (Model 21).
9. **EgoSchema (Blue):** Shows a strong upward trend. Starts at ~64% (Model 3), rises to ~72% (Model 5).
10. **ActivityNet (Orange):** Shows a slight upward trend. Starts at ~59% (Model 3), rises to ~62% (Model 5).
11. **ERQA (Light Blue/Teal):** Shows a steady, strong upward trend. Starts at ~35% (Model 5), rises consistently to ~66% (Model 21).
**Spatial Grounding & Data Points (Approximate):**
* **Top-Left Cluster (Models 3-5):** AI2D, DocVQA, and ChartQA show high initial scores and rapid improvement.
* **Central Volatility (Models 8-13):** CharXiv-D and MMMU show significant dips and recoveries. CharXiv-R hits its lowest point at Model 10.
* **Right-Side Convergence (Models 16-21):** VideoMMMU, MMMU, CharXiv-R, and MMMU-Pro all show strong, converging upward trends, ending in the 78%-84% range.
* **Lower Bound:** ERQA starts the lowest but shows consistent improvement.
### Key Observations
1. **Performance Clustering:** Benchmarks fall into apparent performance tiers by Model 21: Top tier (~84%: VideoMMMU, MMMU), Middle tier (~78-81%: CharXiv-R, MMMU-Pro), Lower tier (~66%: ERQA).
2. **Volatility vs. Stability:** Some benchmarks (CharXiv-D, MMMU, CharXiv-R) show high volatility with sharp drops and recoveries between models, while others (VideoMMMU, MMMU-Pro, ERQA) show smooth, monotonic improvement.
3. **Model Number Correlation:** There is a general, strong positive correlation between Model Number and Score for almost all benchmarks, suggesting later models (higher numbers) are generally more capable.
4. **Notable Outlier Event:** Model Number 10 appears to be a significant point of failure or difficulty for several benchmarks (CharXiv-D, MMMU, CharXiv-R all show sharp dips here).
5. **Early vs. Late Benchmarks:** Benchmarks like AI2D, DocVQA, and ChartQA are only plotted for early models (3-5), while others like ERQA, MMMU-Pro, and CharXiv-R are plotted for a longer range of later models.
### Interpretation
This chart likely visualizes the progression of a series of AI models (perhaps different versions or sizes of a base model family) on a standardized, multi-faceted evaluation suite. The "Model Number" likely represents a sequence of increasing model scale, capability, or training iteration.
The data suggests that:
* **General Capability is Improving:** The dominant upward trend across nearly all tasks indicates that successive models are becoming more capable across a wide range of visual and textual reasoning tasks (document QA, chart understanding, video understanding, etc.).
* **Tasks Have Different Difficulty Profiles:** The varying starting points, slopes, and volatility suggest some tasks (e.g., ERQA) are consistently harder, while others (e.g., AI2D) are mastered earlier. The volatility in tasks like CharXiv-D might indicate sensitivity to specific model changes or training data shifts.
* **The "Model 10" Anomaly:** The synchronized performance drop at Model 10 for multiple benchmarks is a critical investigative point. It could indicate a problematic model version, a change in evaluation methodology, or a specific weakness introduced and later patched in the model lineage.
* **Convergence on Complex Tasks:** The convergence of multiple benchmarks (VideoMMMU, MMMU, CharXiv-R) in the later models suggests that as models scale, their performance on diverse, complex reasoning tasks begins to plateau at a similar high level, potentially indicating a shared underlying capability ceiling or the effectiveness of the training approach across domains.
In essence, the chart tells a story of iterative progress in AI, highlighting both consistent improvement and the non-linear, sometimes fragile nature of advancing capabilities across a broad spectrum of cognitive tasks.
DECODING INTELLIGENCE...