\n
## Heatmaps: Comparison of Exact, Predicted, and Error Values
### Overview
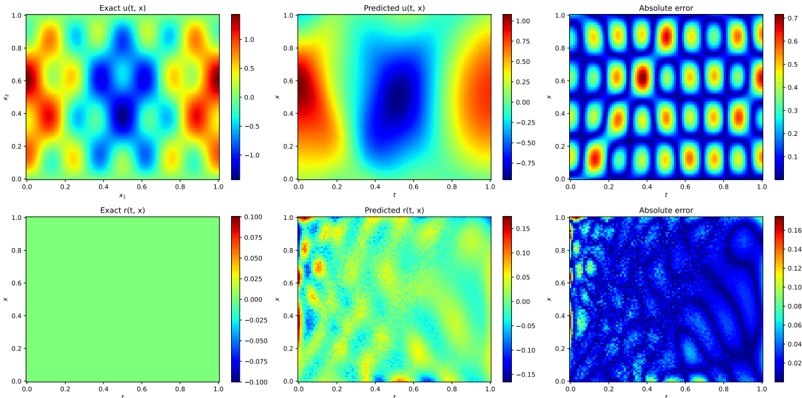
The image presents six heatmaps arranged in a 2x3 grid. Each heatmap visualizes a two-dimensional function, likely representing a time-dependent variable 't' against a spatial coordinate 'x'. The heatmaps compare the "Exact" function, a "Predicted" function, and the "Absolute Error" between the two. There are two sets of comparisons, one with a larger scale and one with a smaller scale.
### Components/Axes
Each heatmap shares the following components:
* **X-axis:** Labeled as 'x', ranging from approximately 0.0 to 1.0.
* **Y-axis:** Labeled as 't', ranging from approximately 0.0 to 1.0.
* **Colorbar:** Each heatmap has a colorbar on the right side indicating the value corresponding to each color. The colorbars have different scales for each heatmap.
The heatmaps are organized as follows:
1. Top-Left: "Exact u(t, x)" - Colorbar ranges from approximately -1.0 to 1.0.
2. Top-Center: "Predicted u(t, x)" - Colorbar ranges from approximately -0.75 to 0.75.
3. Top-Right: "Absolute error" - Colorbar ranges from approximately 0.0 to 0.3.
4. Bottom-Left: "Exact r(t, x)" - Colorbar ranges from approximately -0.075 to 0.075.
5. Bottom-Center: "Predicted r(t, x)" - Colorbar ranges from approximately -0.15 to 0.15.
6. Bottom-Right: "Absolute error" - Colorbar ranges from approximately 0.0 to 0.16.
### Detailed Analysis or Content Details
**Top Row:**
* **Exact u(t, x):** Shows a pattern of alternating positive and negative regions, forming roughly circular or elliptical shapes. The maximum positive values are around 1.0, and the maximum negative values are around -1.0. The pattern is periodic in both 't' and 'x'.
* **Predicted u(t, x):** Displays a similar pattern to the "Exact" function, but with reduced amplitude. The maximum positive values are around 0.75, and the maximum negative values are around -0.75. The predicted values appear smoothed compared to the exact values.
* **Absolute Error:** Shows the difference between the "Exact" and "Predicted" functions. The error is concentrated in the regions where the "Exact" function has high amplitude. The maximum error is around 0.3. The error pattern mirrors the periodic structure of the original functions.
**Bottom Row:**
* **Exact r(t, x):** Shows a relatively flat green surface with small variations. The values are centered around 0.0, with a range of approximately -0.075 to 0.075.
* **Predicted r(t, x):** Displays a similar pattern to the "Exact" function, but with more pronounced variations. The values range from approximately -0.15 to 0.15.
* **Absolute Error:** Shows the difference between the "Exact" and "Predicted" functions. The error is more significant than in the top row, with a maximum error of around 0.16. The error pattern is more complex and less periodic than the top row.
### Key Observations
* The "Predicted" functions generally follow the pattern of the "Exact" functions, but with reduced amplitude in the top row and increased variation in the bottom row.
* The "Absolute Error" is highest in the regions where the "Exact" function has the largest variations.
* The error in the bottom row is significantly higher than in the top row, suggesting that the prediction is less accurate for the 'r' function compared to the 'u' function.
* The color scales are different for each heatmap, indicating that the functions have different ranges of values.
### Interpretation
The image demonstrates a comparison between an exact solution and a predicted solution for two functions, 'u(t, x)' and 'r(t, x)'. The heatmaps visualize the accuracy of the prediction by showing the absolute error between the exact and predicted values.
The top row suggests a relatively accurate prediction for 'u(t, x)', with a small error concentrated in regions of high variation. The bottom row indicates a less accurate prediction for 'r(t, x)', with a larger and more complex error pattern.
The differences in error levels between the two functions could be due to several factors, such as the complexity of the functions, the quality of the prediction model, or the limitations of the numerical methods used to solve the equations. The image provides a visual representation of the prediction accuracy and highlights areas where the prediction model could be improved. The functions 'u' and 'r' may represent different physical quantities or different stages in a simulation, and the varying prediction accuracy could have implications for the overall reliability of the results.