## Diagram: Beta Reduction Examples
### Overview
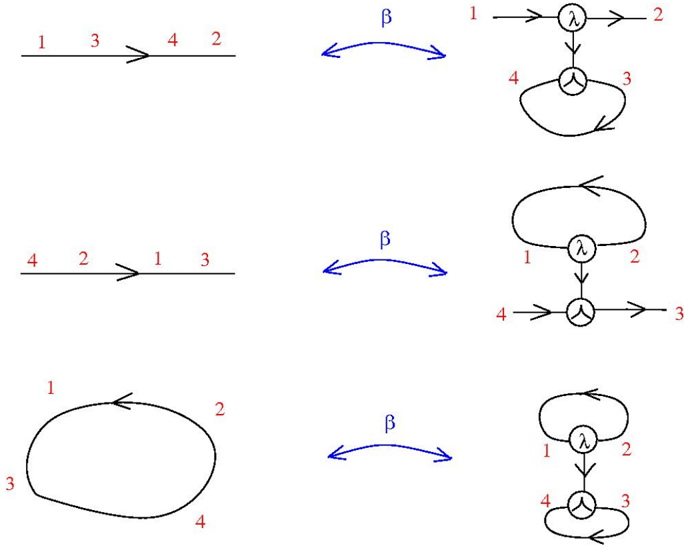
The image illustrates examples of beta reduction in a diagrammatic notation. It shows three separate cases, each demonstrating a transformation from one diagrammatic representation to another, connected by a "beta" reduction step.
### Components/Axes
* **Diagrams:** Each case consists of two diagrams. The left-hand side diagram is transformed into the right-hand side diagram.
* **Arrows:** Arrows represent connections or flow. They can be straight lines or curved loops.
* **Nodes:** Nodes are represented by circles. Some nodes contain the symbol "λ" inside. Other nodes contain a symbol resembling an upside-down lambda.
* **Labels:** Red numbers (1, 2, 3, 4) label the connections or endpoints of the diagrams.
* **Beta Reduction Indicator:** A blue curved arrow labeled "β" indicates the beta reduction step between the diagrams.
### Detailed Analysis
**Case 1 (Top Row):**
* **Left Diagram:** A straight arrow with labels 1, 3, 4, and 2. The arrow points from 1 to 2. The labels are ordered as 1-3-4-2 along the line.
* **Beta Reduction:** Indicated by the blue "β" arrow.
* **Right Diagram:** A node containing "λ" with incoming arrow labeled 1 and outgoing arrow labeled 2. A node containing an upside-down lambda is connected to the "λ" node by a downward arrow. This second node has an outgoing loop labeled 4 and an outgoing arrow labeled 3.
**Case 2 (Middle Row):**
* **Left Diagram:** A straight arrow with labels 4, 2, 1, and 3. The arrow points from 4 to 3. The labels are ordered as 4-2-1-3 along the line.
* **Beta Reduction:** Indicated by the blue "β" arrow.
* **Right Diagram:** A node containing "λ" with a loop labeled 1 and 2. A node containing an upside-down lambda is connected to the "λ" node by a downward arrow. This second node has incoming arrow labeled 4 and outgoing arrow labeled 3.
**Case 3 (Bottom Row):**
* **Left Diagram:** A closed loop with labels 1, 2, 4, and 3. The loop proceeds from 1 to 2 to 4 to 3 and back to 1.
* **Beta Reduction:** Indicated by the blue "β" arrow.
* **Right Diagram:** A node containing "λ" with a loop labeled 1 and 2. A node containing an upside-down lambda is connected to the "λ" node by a downward arrow. This second node has an outgoing loop labeled 4 and an outgoing arrow labeled 3.
### Key Observations
* Each case demonstrates a transformation of a diagram involving arrows and labels into a diagram involving nodes with "λ" and upside-down lambda symbols.
* The "β" arrow consistently indicates a beta reduction step.
* The red numbers appear to represent indices or labels associated with the connections in the diagrams.
### Interpretation
The diagrams illustrate beta reduction, a fundamental concept in lambda calculus and functional programming. The "β" arrow represents the application of a beta reduction rule, which involves substituting a value for a variable within a lambda expression. The diagrams provide a visual representation of this substitution process, showing how the connections and labels are rearranged during the reduction. The "λ" symbol represents a lambda abstraction, while the upside-down lambda symbol likely represents an application or a bound variable. The specific meaning of the diagrams would depend on the precise notation being used, but the overall concept is the transformation of a lambda expression through substitution.